
Managing data models
The Models tab allows you not only to create a new data model, but also to manage the various data models you have created.


| 1: List of data models | The central pane lists the data models created within the selected role, in this case the HR role.
|
|---|---|
| 2: Categories panel | You can organise your data models into categories and sub-categories. By default, there are two categories: ‘All’, which contains all models, and ‘Uncategorised’, which contains models not assigned to a category. See the section below to find out more about how to create categories and assign data models to them. |
| 3: Toolbar | The toolbar allows you to change display settings, refresh the view and access analysis tools. |
| 4: Search bar | If there are a large number of data models, the search bar makes it easier to find the one you want. Click the Toggle the slider See the section Searching for a data model for further details. |

Managing categories
Creating categories and sub-categories
To create a category:
- Right-click on one of the default categories,‘All ’ or ‘Uncategorised’, then click ‘+ Create category’.

- In the box that appears, enter the name of the new category and click OK.
➡ The new category is added to the list of categories.
To create a sub-category, follow the same procedure from a category you have created.
Assigning a data model to a category
To assign a data model to a category:
- Right-click on the model.
- In the context menu that appears, click ‘Assign to category’ and then select the category from the list of existing categories.

You can also create a category from the data model and assign it to that category:
- Right-click on the model.
- In the context menu that appears, click on ‘Assign to category’ and then ‘New...’
- In the Category box, enter a name. To add a sub-category, add a / followed by the name of the sub-category as follows:
Category/Sub-category. - Click the
 if you wish to specify the multilingual version.
 - Click OK to confirm.
Viewing the hierarchical view of data models
You can view all elements associated with the data model – dimensions, measures, formats, targets, variables, etc. – to gain an overview. To do this:
- Click the
 .
. - In the context menu that appears, click on ‘Hierarchical view’ and then select the elements you wish to display or ‘Show all’.

- Click the small arrow
 to the left of a model to display the associated items, or click the ‘Expand All’ button
  in the toolbar to display all items in all models.
Copying and pasting elements from a data model
By right-clicking on the desired element, you can copy and paste a calculated measure, a format, a target or a variable within the same model or from one data model to another, as well as edit or duplicate it.
You can also copy and paste sets and hierarchies from one dimension to another within the same data model. In the case of specific hierarchies, this allows you to avoid having to recreate them.

Search for a data model
If there are a large number of data models, the search bar makes it easier to find the data model(s) you are looking for:
- Enter the search term: the results are then automatically filtered.
- Toggle the slider
 if you wish to search across all roles.
In this case, the number of results found is shown in brackets for each role:


You can restrict the search to data models based on one or more types of data source:
- Click the button
 to display the list of data source types.
- Tick the data source types you wish to filter by.
➡ The data source types are displayed as icons in the search bar.
Analysis tools
Three analysis tools are available via the Dependency Analysis button.

Dependency Analysis
Dependency analysis is a mechanism that allows you to identify the relationships between the various elements of your environment. Here, it focuses on the role’s data models. See the page Dependency Analysis for further details.
Data Model Graph
The ‘Data Model Graph…’ option opens a window displaying a graphical representation of the selected data models and associated elements (flows, unions, etc.), as well as the links between them.
Select an element to view the associated information.
Various options are available in the top-left corner of the window.

| Symbol | Description |
|---|---|
 | Data model |
 | Workflow |
 | Union of data models |
 | Data model join |
 | Data model transformer |
 | Column transformer |
Analysis Tool
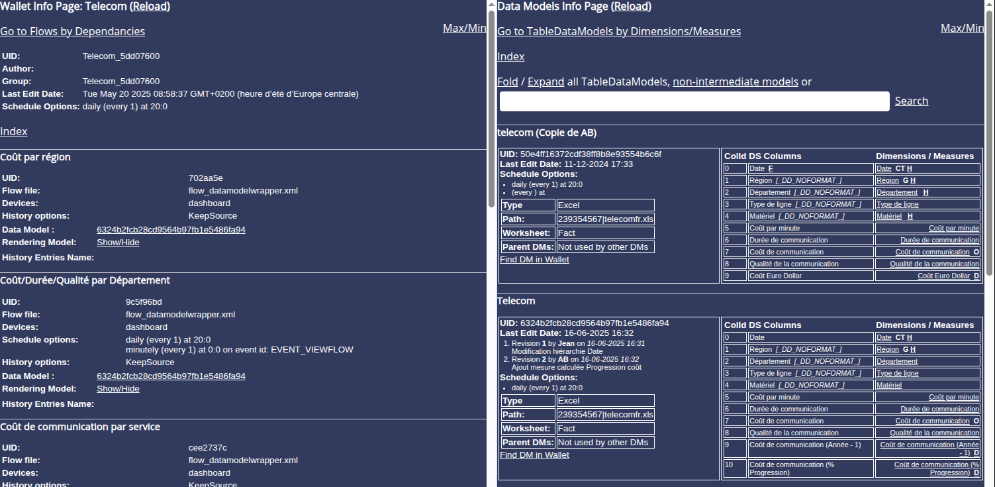
The ‘Analysis Tool...’ option opens a window containing detailed information about the data models and flows for the selected role.
Sharing a data model
It is possible to share a data model from one role to another. To do this:
- Right-click on the data model you wish to share.
- In the context menu that appears, click Share...
➡ The Share with dialogue box appears. - Tick the role(s) with which you wish to share the data model, then click OK.
➡ The model is added to the list of data models for the selected role(s) and the original role is indicated in the ‘Shared by’ column.
💡 To find out more about the differences between the parent/child role system and data model sharing, see the page Parent/Child Role System versus Data Model Sharing.
Rules for sharing a data model
In the context of a named user (non-OEM) and multiple roles, including:
- a locked ‘parent’ role
- one or more ‘child’ roles of the ‘parent’ role
- another role, which we shall refer to here as “external”,
the sharing rules are as follows:
💡See the page Manage roles for more details on roles.
- Sharing from an “external” role to a “child” role is not permitted, regardless of the user’s permissions.
- Sharing between two “child” roles of the same “parent” role is permitted if the user’s permissions and the data model allow it.
- Sharing from an “external” role to the “parent” role is not permitted, regardless of the user’s permissions (as it is locked).
- Sharing from a “parent” role – whether locked or not – to an “external” role is permitted if the user’s permissions and the data model allow it.
View cube statistics
It is possible to generate a cube statistics report showing outliers, anomalies, measure statistics, etc.
- Right-click on the data model.
- In the context menu that appears, click ‘Cube Statistics’.
➡ A ‘Cube Statistics’ window opens, displaying detailed information about the cube and its associated elements.
You can export these statistics to a CSV file: in the ‘Export CSV’ section at the bottom of the window, select the statistics you require and then click the ‘Export’ button.