
Afficher un tableau de bord
- Sauvegarder un graphique en PDT, PPT, Excel ou CSV
- Ajouter et voir les commentaires
- Maximiser ou minimiser un graphique
- Interagir sur les éléments du tableau de bord
- Paramétrer les URL du tableau de bord
- Rechercher dans les filtres
- Affichage sur "Mobile"
Ce guide présente le Dashboard qui est le module qui vous permet de visualiser le tableau de bord que vous avez construit dans l'Éditeur de tableaux de bord. Vous pouvez y naviguer dans vos données, ajouter des commentaires, exporter vos graphiques, etc
Pour accéder au Dashboard, cliquez sur le bouton DashBoard de la page d'accueil de DigDash Enterprise et entrez vos identifiants
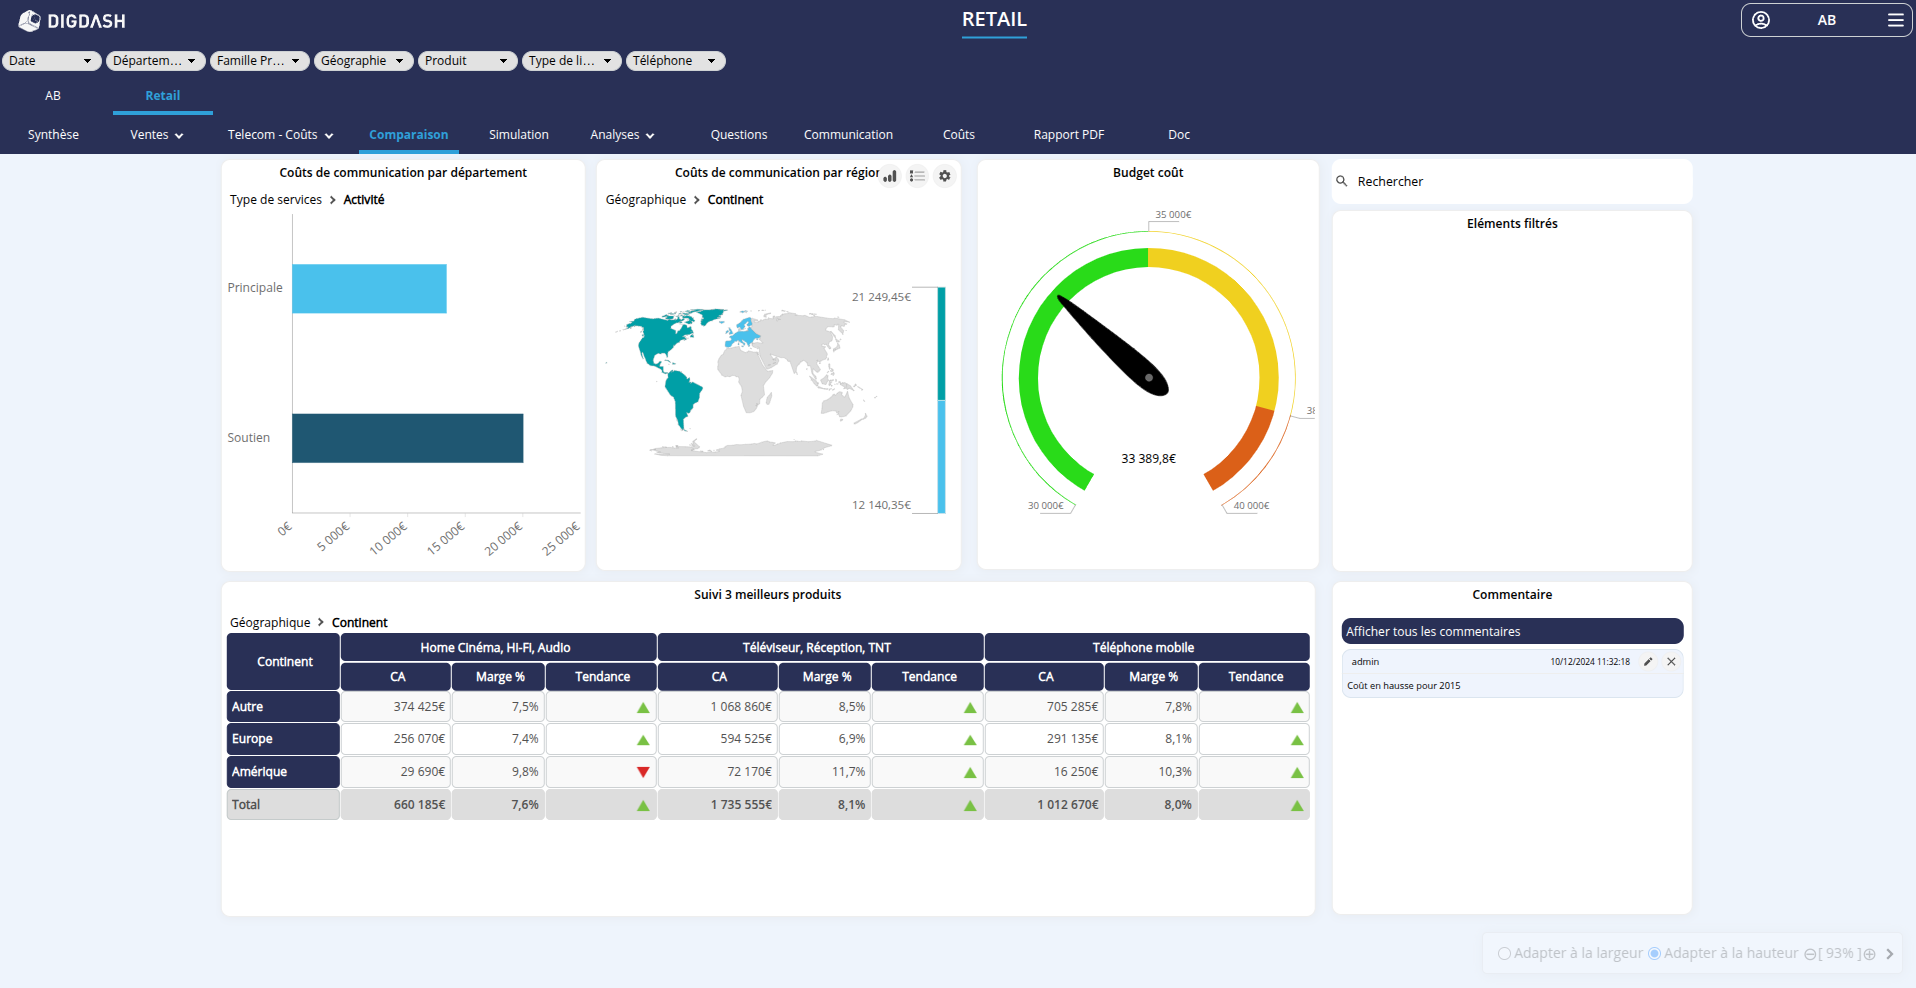
Votre tableau de bord s'affiche. Pour afficher le tableau de bord d'un rôle cliquez sur l'onglet portant le nom de ce rôle. Par exemple, l'utilisateur AB ayant dans son entreprise des données Ventes et Telecom affiche la page de tableau de bord Comparaison en sélectionnant l'onglet correspondant.
Un menu déployable depuis le nom d'utilisateur offre plusieurs options avancées.
| Commande | Description |
|---|---|
| Réinitialiser la position des rôles | Disponible uniquement si la position des rôles a été modifiée pour l'utilisateur. Rétablir l'ordre par défaut des rôles. Consultez la page Ordonner les rôles dans le tableau de bord pour plus de détails. |
| Masquer / Afficher les filtres | Masquer / Afficher la barre de filtres du tableau de bord
|
| Navigation | Ouvrir le menu de navigation afin d'accéder aux options de sélection de navigation. Consultez le paragraphe Modifier la sélection de navigation pour plus de détails. |
| Interaction par défaut | Modifier l'interaction par défaut utilisée au clic sur un élément. Consultez le paragraphe Modifier l'interaction par défaut pour plus de détails. |
Rafraîchir | Recharger tous les rôles. |
| Éditeur | Disponible uniquement si l'utilisateur a les autorisations nécessaires. Ouvrir l'Éditeur de tableaux de bord dans un nouvel onglet. |
| Studio | Disponible uniquement si l'utilisateur a les autorisations nécessaires. Ouvrir le Studio dans un nouvel onglet. |
| Configuration | Disponible uniquement si l'utilisateur a les autorisations nécessaires. Ouvrir la page d'accueil de configuration dans un nouvel onglet. |
| Déconnexion | Se déconnecter du Dashboard. |
Depuis le tableau de bord, vous pouvez exécuter un certain nombres d'actions décrites dans les paragraphes suivants.
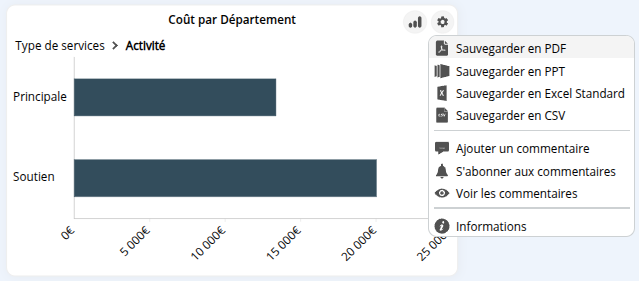
Sauvegarder un graphique en PDT, PPT, Excel ou CSV
Pour sauvegarder un élément du tableau de bord aux formats PDF, PPT ou Excel (vous devez avoir l'autorisation Sauvegarder en PDF, Sauvegarder en PPT, Sauvegarder en Excel ou Sauvegarder en CSV et avoir activé les options depuis l'éditeur) : cliquez sur l'icône Editer ![]() en haut à droite de l'élément souhaité puis sélectionnez Sauvegarder en PDF , Sauvegarder en PPT , Sauvegarder en Excel Standard, Sauvegarder en Excel Rapide ou Sauvegarder en CSV.
en haut à droite de l'élément souhaité puis sélectionnez Sauvegarder en PDF , Sauvegarder en PPT , Sauvegarder en Excel Standard, Sauvegarder en Excel Rapide ou Sauvegarder en CSV.
💡 Export Excel des tableaux
- L'option Sauvergarder en Excel Standard conserve l'ensemble des styles.
- L'option Sauvegarder en Excel Rapide conserve seulement une partie de styles. Elle permet une génération plus rapide tout en conservant une mise en forme. Consultez la page Options d'export pour plus de détails.
Ajouter et voir les commentaires
Consultez la page dédiée Ajouter et voir les commentaires.
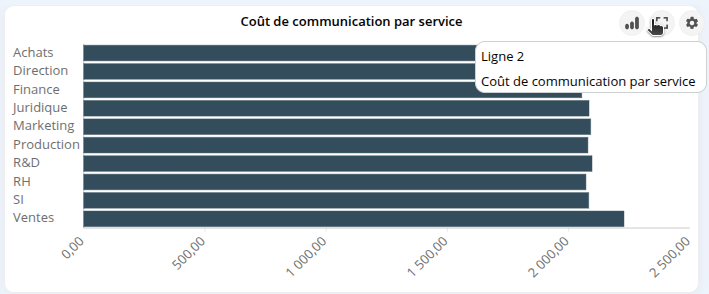
Maximiser ou minimiser un graphique
Cliquez sur l'icône Maximiser![]() ou Minimiser
ou Minimiser ![]() en haut à droite de l'élément.
en haut à droite de l'élément.
Dans le cas où l'option est disponible pour des objets imbriqués (par exemple, une ligne et le graphique à droite de cette ligne), un seul bouton permet de choisir l'élément à maximiser.
Interagir sur les éléments du tableau de bord
Consultez la page dédiée Interagir sur les éléments du tableau de bord pour plus de détails.
Paramétrer les URL du tableau de bord
Il est possible de paramétrer les URL du tableau de bord :
- le nom de l'utilisateur et son mot de passe,
- le nom de la page à afficher,
- une liste de filtres,
- les valeurs des variables,
- l'affichage ou non de la bannière et de la barre de filtres,...
Consultez la documentation Intégrer un tableau de bord dans une page web pour les détails sur ces paramètres ainsi que sur l'intégration de DigDash dans les sites webs.
Rechercher dans les filtres
Certains filtres (filtres de type Liste verticale/horizontale, Liste déroulante et Cases à cocher) ainsi que l'élément de contenu additionnel Recherche dans l'interface, disposent d'un champ de recherche.
Le fonctionnement de la recherche à l’intérieur de ces filtres repose sur un système de pertinence basé sur les mots saisis par l'utilisateur.
Lorsque vous tapez une phrase dans le champ de recherche, plusieurs étapes sont suivies pour trouver les résultats les plus pertinents.
- Découpage de la phrase :
La phrase saisie est automatiquement découpée en mots. La séparation se fait à chaque fois qu’il y a :- un espace (" ")
- un slash ("/")
- un tiret ("-")
Par exemple, si on saisit "réseau femmes-entrepreneures", les mots obtenus sont "réseau", "femmes" et "entrepreneures".
- Calcul du score de pertinence :
Les mots saisis sont comparés aux membres disponibles.
Plusieurs critères sont pris en compte :- Nombre de mots correspondants
Plus le membre contient de mots recherchés, meilleur est le score.
Un membre contenant les 3 mots saisis aura un meilleur qu'un membre contenant 2 mots. Par exemple, le membre "Femmes entrepreneures du réseau francophone" aura un meilleur score que "Femmes entrepreneures de France". - Ordre des mots respecté
Plus l'ordre des mots est respecté, meilleur est le score.
Un membre contenant 2 mots recherchés dans l'ordre aura un meilleur score qu'un membre contenant les 2 mots dans un ordre différent.
Par exemple, le membre "Réseau des femmes dirigeantes" aura un meilleur score que "Femmes et réseau professionnel" . - Le nombre de mots dans les membres
Moins le membre contenant les mots recherchés comporte de mots, meilleur est le score.
Un membre contenant 2 mots saisis parmi 5 mots aura un meilleur score qu'un membre contenant ces mêmes mots parmi 8 mots.
Par exemple, le membre "Réseau d’entraide des femmes entrepreneures" aura un meilleur score que "Réseau national d'entraide des jeunes femmes entrepreneures". - Position des mots recherchés
Plus les mots recherchés se situent au début du membre, meilleur est le score.
Par exemple, le membre "Femmes et droits" aura un meilleur score que "Droits des femmes".
- Nombre de mots correspondants
- Tri des résultats
Les résultats sont ensuite classés par ordre décroissant de score (plus pertinent en haut).
Affichage sur "Mobile"
Consultez la page dédiée Tableaux de bord mobile pour des informations détaillées sur l'affichage sur mobile (petit écran).