Connector Google Analytics
- Prerequisites
- Selecting a new datasource
- Authentication
- Date range
- Dimensions and measures
- Advanced options
Prerequisites
- A Google Analytics account with the authentication information for Digdash (see next point)
- Follow the configuration document called « google_analytics_config_en.pdf » to get all the necessary identifiers (service account + .p12 file + Google Analytics’ ID account)
Selecting a new datasource
DigDash Enterprise allows you to retrieve information from your Google Analytics account.
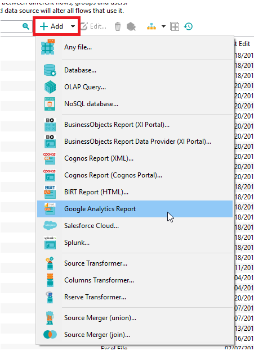
Select the type of report you want to work with, in the toolbar at the bottom of the page.


OR click on New model in the datasource manager tab and choose Google Analytics Report.

Authentication
Follow the configuration document called “google_analytics_config_en.pdf” and get the information to specify.


 Enter this information in the corresponding fields.
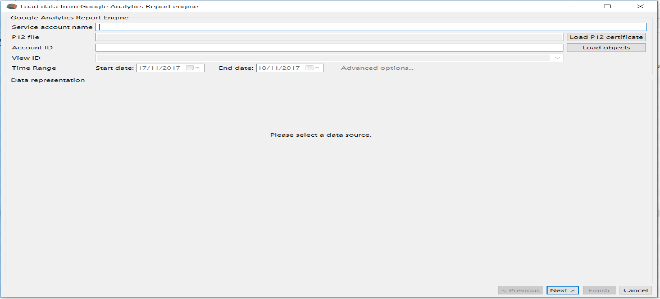
Screenshot: Interface for authentication and loafing Google analytics objects
 Service account: It is the account name in an email address form that you got at the creation of the service account in the Google Cloud console.
 P12 file : It is the secret key in a .p12 file form generated and that you downloaded at the creation of the service account in the Google Cloud console.
 Account ID: It is the Google Analytics’ account ID you want to work with.
 View ID (post- authentification) : A Google Analytics account can have multiple views, Choose the one you want to work with.
 Time range (post- authentification): You can get your data for a given time range.
 Data representation (post-authentication): It is in this view that you will get to visualize your Google Analytics metrics and dimensions.
Once authenticated, click on the button “Load objects” to load information related to you Google Analytics account in Digdash.
After loading the objects, you will get this view:
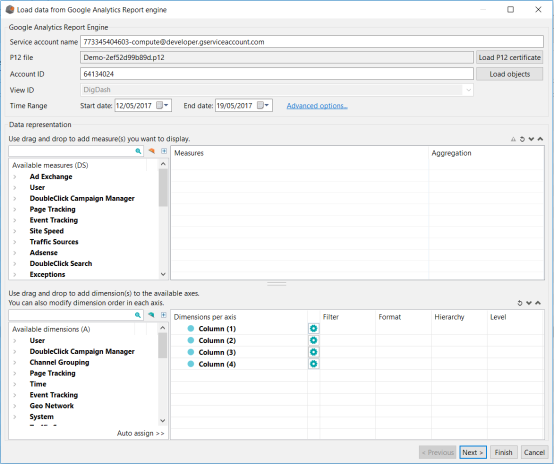
Screenshot: Loading objects after authentication
Date range
You can specify a static period of time to get data related to this time range, mentioning two dates.

Screenshot: Selecting dates to define a static period of time
Note: In Digdash, the end date of a period of time is always excluded. The maximum for the end date is the day after the current day. Example: if you want to get your date from the 1st of January 2016 (included) to the 31st of January 2016 (included), you will need to mention the 1st of January 2016 as start date and the 1st of February 2016 as end date.
Dimensions and measures
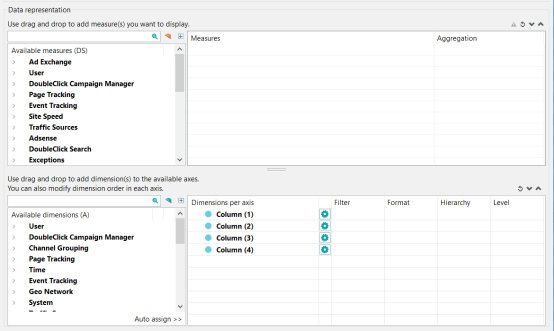


Screenshot : Description of the interface for metrics/dimensions selection
1 : Available measures zone 2 : selected measures zone
3 : Available dimensions zone 4 : Selected dimensions zone
The top side is related to Google Analytics measures/metrics.
 Measures are on the left side, in categories.
You can filter on the measures’ names (not the categories) in the search bar.
 You can drag and drop from the left side to the right side to select a measure.
The bottom side is related to Google Analytics dimensions.
 Dimensions are on the left side, in categories.
You can filter on the dimensions’ names (not the categories) in the search bar.
 You can drag and drop from the left side to the right side to select a dimension.
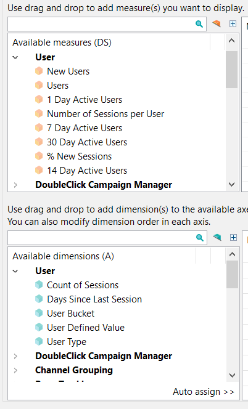
Screenshot: Metrics and dimensions are grouped into categories
Combinations possibilities
It is possible to combine:
metrics and dimensions
only metrics
It is not possible to have only dimensions, though.
Valid combinations
All combinations metrics-dimensions or metrics-metrics are not always valid.
Digdash is able to give you some hints on the valid combinations.
You can still go the Google documentation to make sure the combinations of metrics-dimensions you selected are valid.
https://developers.google.com/analytics/devguides/reporting/core/dimsmets
When selecting a metric or a dimension on the right side, you can see on the left side the non compatible dimensions and metrics with the selected dimension or metric.
There are three representations for a measure:
 Selected measure
 Available measure
 Non compatible measure with one of the selected columns
There are three representations for a dimension: Selected dimension
 Available dimension
 Non compatible dimension with one of the selected columns
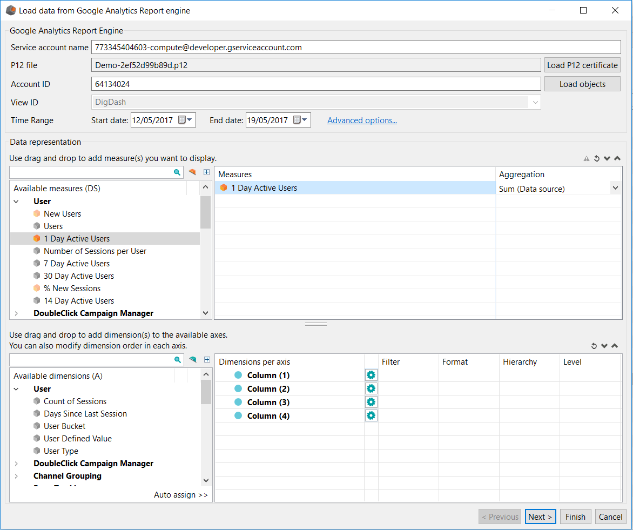
Screenshot : When selecting metric 1 Day Active Users :
Among other metrics, measures like 7 Day Active Users and 14 Day Active Users are not compatible with the selected metric Among other dimensions, dimensions like User Type and Count of Sessions are not compatible with the selected metric
Digdash lets you select all the columns you want anyways, even invalid. A status icon exist in the interface letting you know that your query might not be valid.
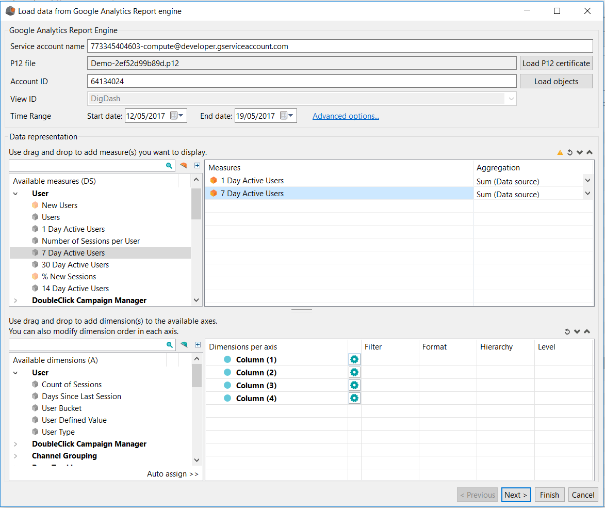

Screenshot: Activation of the status icon when Digdash detects incompatibilities between the selected columns
Advanced options
You can configure your Google Analytics data source with more advanced options.
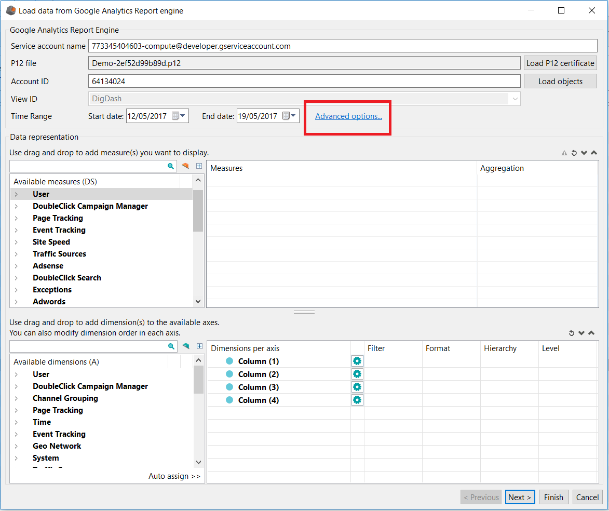
Screenshot: Advanced options for Google Analytics datasource
Click on « Advanced options… ».
The advanced options dialog shows:
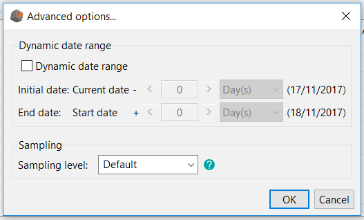
Screenshot: Advanced options dialog
Dynamic date range
It is possible for you to define dynamic periods of time mentioning a time frame from the current date.
To activate this option, select the checkbox “Dynamic date range”.
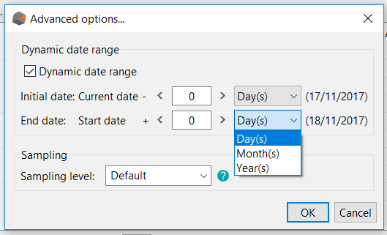
Screenshot: Description of the definition of a dynamic date range
Definition of a dynamic date range:
- Definition of the initial date: it is the current date to which you are SUBSTRACTING X steps of time.
- Definition of the end date: it is the initial date previously defined to which you are ADDING Y steps of time.
With:
- X and Y two positive integers ≥ 0
- steps of time that can be days, months, years.
Sampling level
When it comes to non Premium Google Analytics accounts (that are not Google Analytics 360 accounts, free), Google applies a sampling level on the retrieved data to get a faster response. This sampling level has a role on the precison of the returned data.
You are suggested three options if you own a non Premium Google Analytics account:
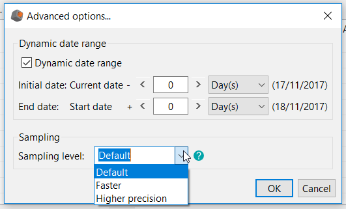
Screenshot: Description of the different sampling levels
- Default: returns a response with a sample size that balances speed and accuracy.
- Faster: returns a fast response with a smaller sample size.
- Higher precision: returns a more accurate response using a large sample size, but this may result in the response being slower.