Comparing data against a reference date
- Introduction
- Prerequisites
- Step 1: Create and configure the data model
- Step 2: Create a table "Communication Cost Evolution"
- Step 3: Create the dashboard page
- Step 4: Navigate the data
- Congratulations!
Introduction
In this tutorial, we are going to find out how to compare data against a selectable reference year.
It will be possible to choose the year of analysis and the year of comparison (reference). Two date filters will be available on the dashboard for this purpose.
This tutorial uses a fictitious dataset from a telecommunications company containing information such as call cost and duration, line type, call quality, etc. This data is contained in the Excel file "".
We will begin by preparing the data, from importing the data to creating a table using Studio. We can then create a page in the Dashboard Editor and compare our data in the Dashboard. Here we will compare the company's communication costs between different years.
Prerequisites
In order to complete this tutorial, you will need to :
- have installed DigDash Enterprise version 2025R1 or higher;
- be a user with the "Data Model Designer" and "Dashboard Designer" authorization groups
- download the Excel file ""
ℹ The screenshots in this tutorial were produced using the Chrome browser. There may be slight differences depending on the browser.
Step 1: Create and configure the data model
Import the data "Telecom"
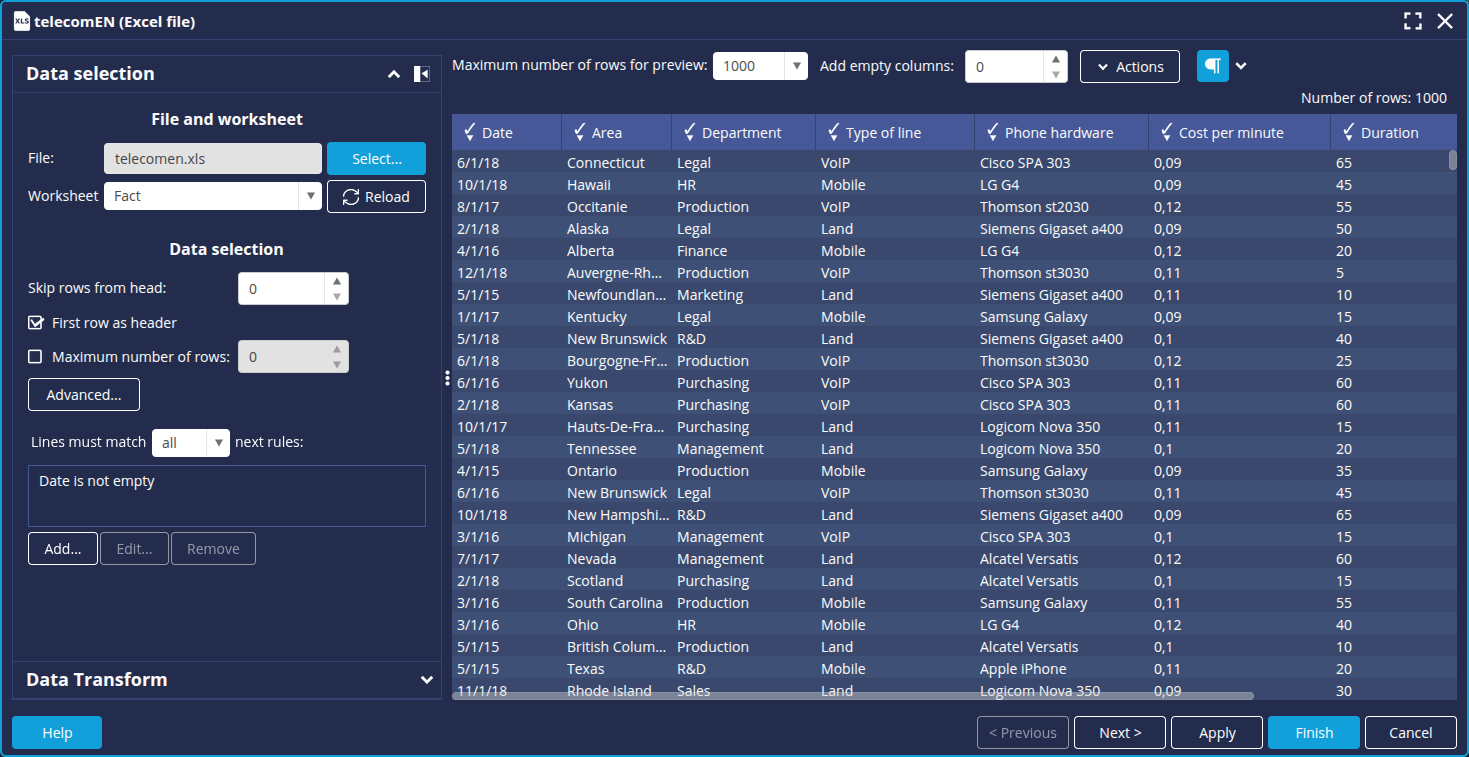
If you have not already created the data model Telecom, follow the instructions in Step 2: Create the data model 'telecom' of the Advanced Tutorial to the end of the Import the data source "telecom" section. You will then see the following screen:
Modify the model columns
We're going to rename the column Date and duplicate it to create a comparison date.
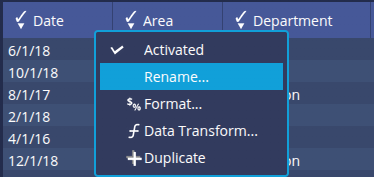
- Click the header of the Date column and then, in the pop-up menu which appears, click Rename.
- Enter the new name Analysis Date and click OK.
➡ The column is now called Analysis Date.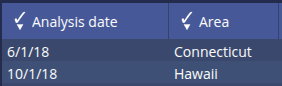
- Click the Analysis Date column header and then click Duplicate.
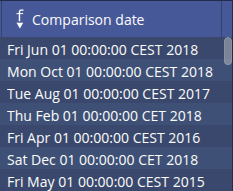
➡ A new Copy of Analysis Date column is added. - Rename it to Comparison Date.
You now have 2 date columns which you can use to select the 2 dates to be compared. However, the duplicate column is not identified as a date. You therefore need to specify it.
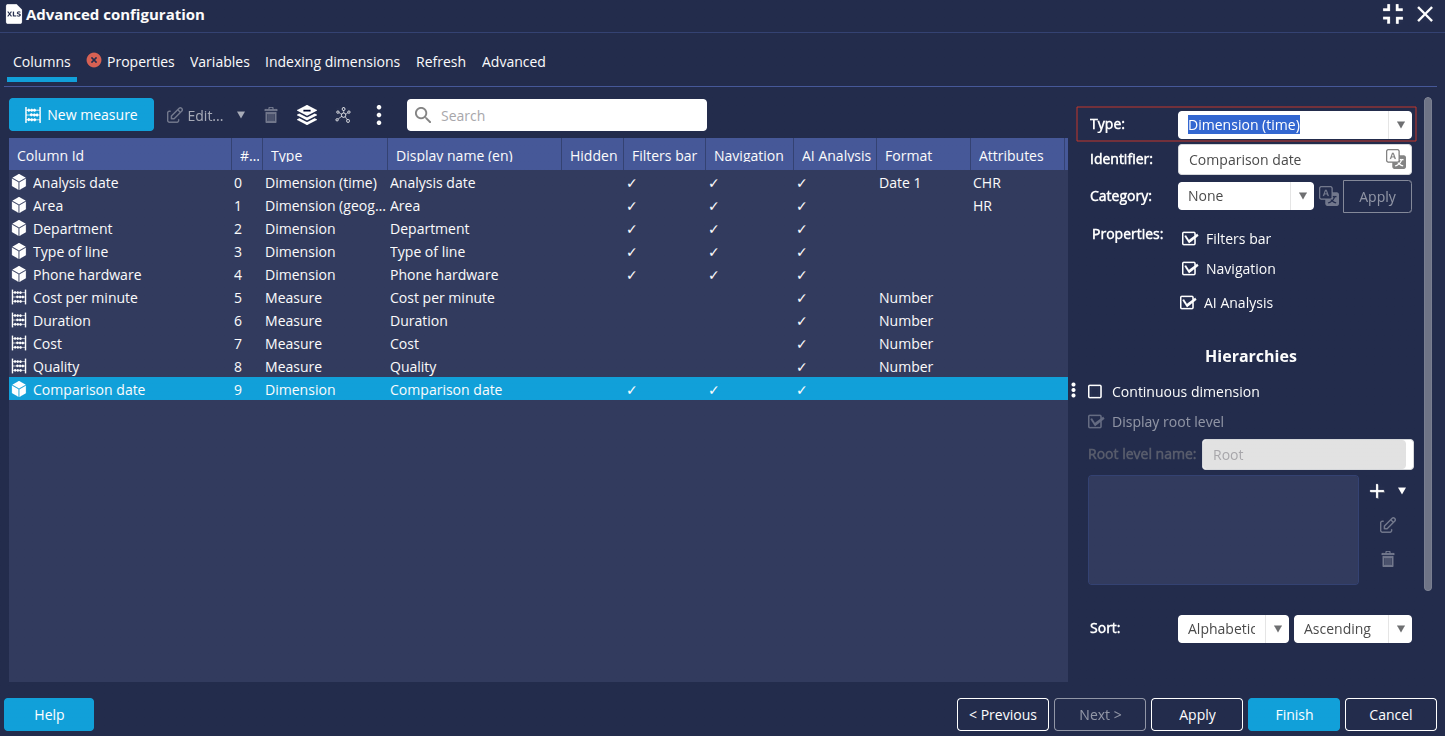
- Click Next to access the data model configuration.
- In the Columns tab, select Comparison Date and then modify the Type : select Dimension (time).
Creating communication cost measures
We are now going to create 3 new measures for communication costs.
First, we are going to create 2 communication cost measures impacted by different dates: one by Analysis Date, the other by Comparison Date. Then we'll create a measure to calculate the progression between these 2 measures.
First measure: Communication cost Analysis date
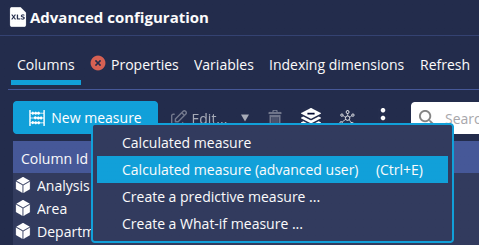
- In the Columns tab, click the New measure button and then select Calculated measure (advanced user).
- Add the measure to be compared using drag-and-drop: in this case, we have chosen Cost.
- Right-click the measure and select Edit.

➡ The Associated measure "Cost" window appears. - Select Comparison date in the Add a dimension drop-down list, then click the + button on the right.
- Uncheck the Navigation box for this Comparison Date dimension and click OK.

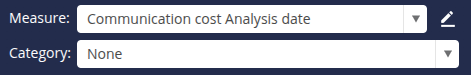
- Name the calculated measure: Communication cost Analysis date.
- Confirm and click OK.
Second measure: Communication cost Comparison date
- Follow the same procedure as above to create the second measurement up to point 3.
- In the Associated measure "Cost" window, select Analysis date in the Add a dimension drop-down list, then click the + button on the right.
- Uncheck the Navigation box for this Analysis date dimension and click OK.

- Name the calculated measure: Communication cost Comparison date.
- Confirm and click OK.
We have created two measures, each impacted by a different date
Third measure: Change in communication cost between the analysis date and the comparison date
- In the Columns tab, click the New Measure button and then select Calculated Measure.
➡ The Calculated Measure via Assistant box appears. - Drag and drop the General -> % Progression function onto the Communication cost Analysis date measure.
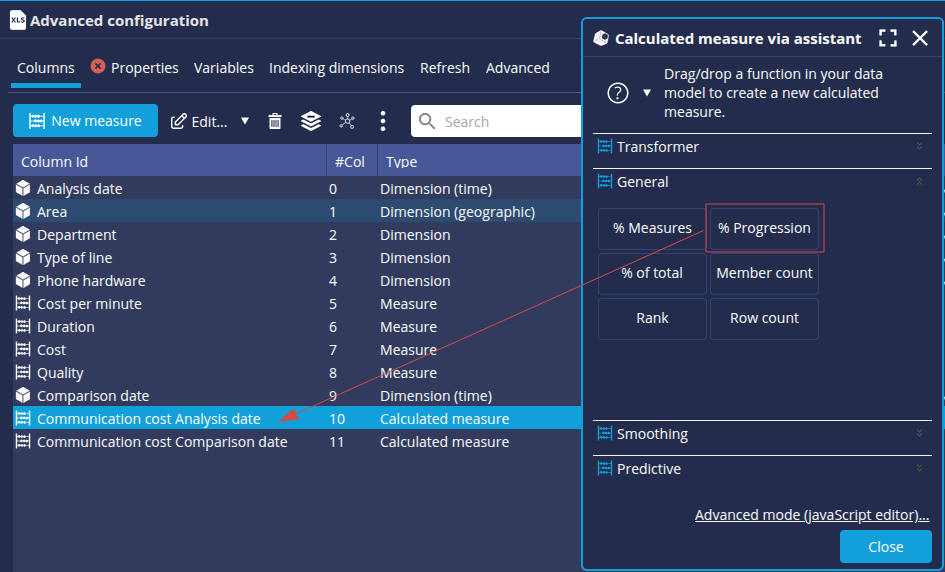
➡ The % Progression box is displayed. - Rename the measurement. Here, we enter Com cost evol between analysis and comparison.
- Select Communication cost Comparison date as the First measure and Communication Cost Analysis date as the Second measure then, click OK.
Save the data model
You can now save the data model:
- Go to the Properties tab and enter the desired Name, for example: telecomen.
- Click the Finish button at the bottom right of the screen.
Step 2: Create a table "Communication Cost Evolution"
Here we are going to create a table showing the change in communication cost between the analysis date and the comparison date, depending on the type of line.
- From the Studio Flow tab, create a new flow Table. Go to the Table page for more details.
- Add the dimension Type of line and then the measures Communication cost Comparison date, Communication cost Analysis date and Com cost evol between analysis and comparison.
- Modify the flow Name as desired. Here, we choose Communication Cost Evolution.
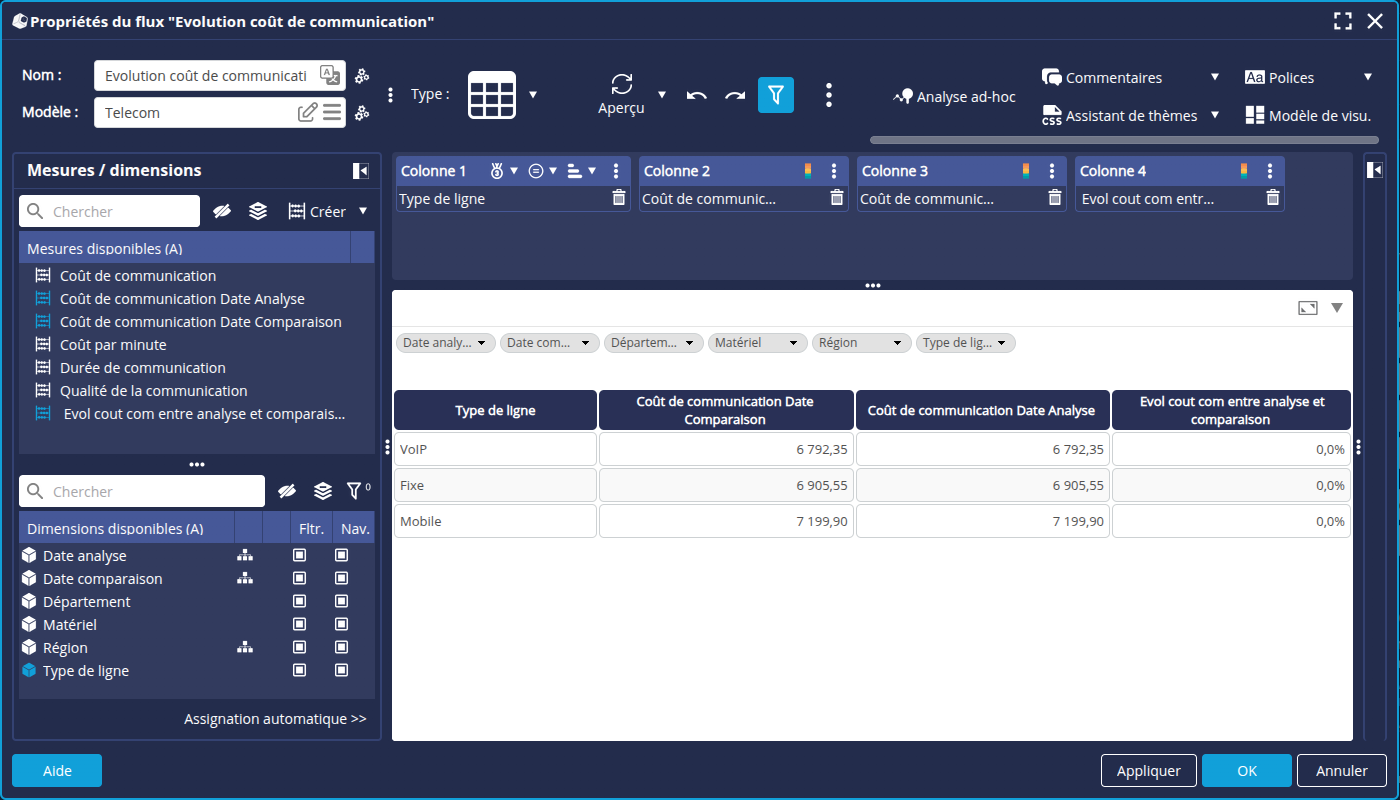
- Click OK to save and close.
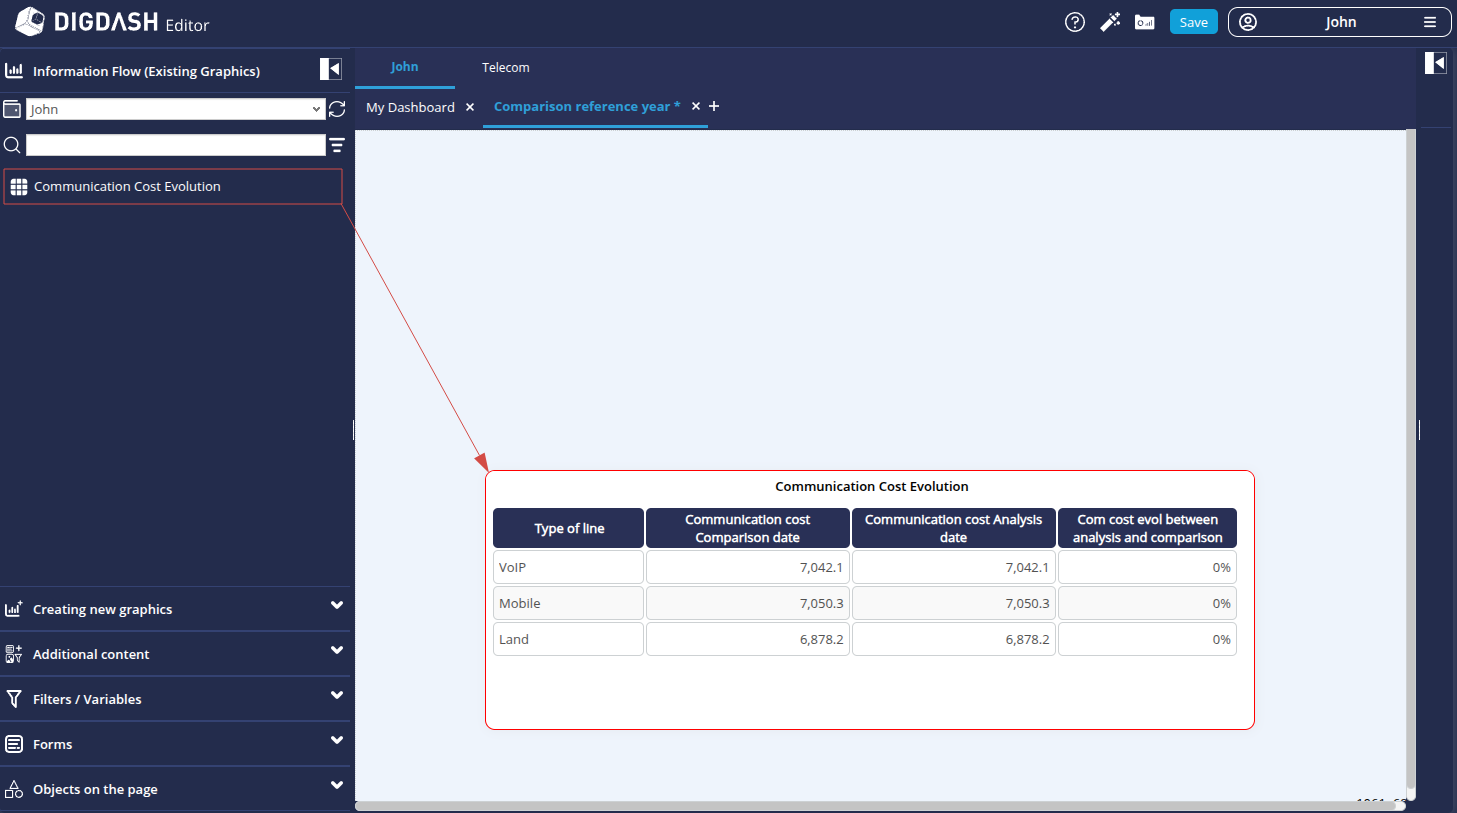
Step 3: Create the dashboard page
- In the Dashboard Editor, create a new page Comparison reference year.
- Drag and drop the table Communication Cost Evolution from the Information Flow tab (Existing Charts).
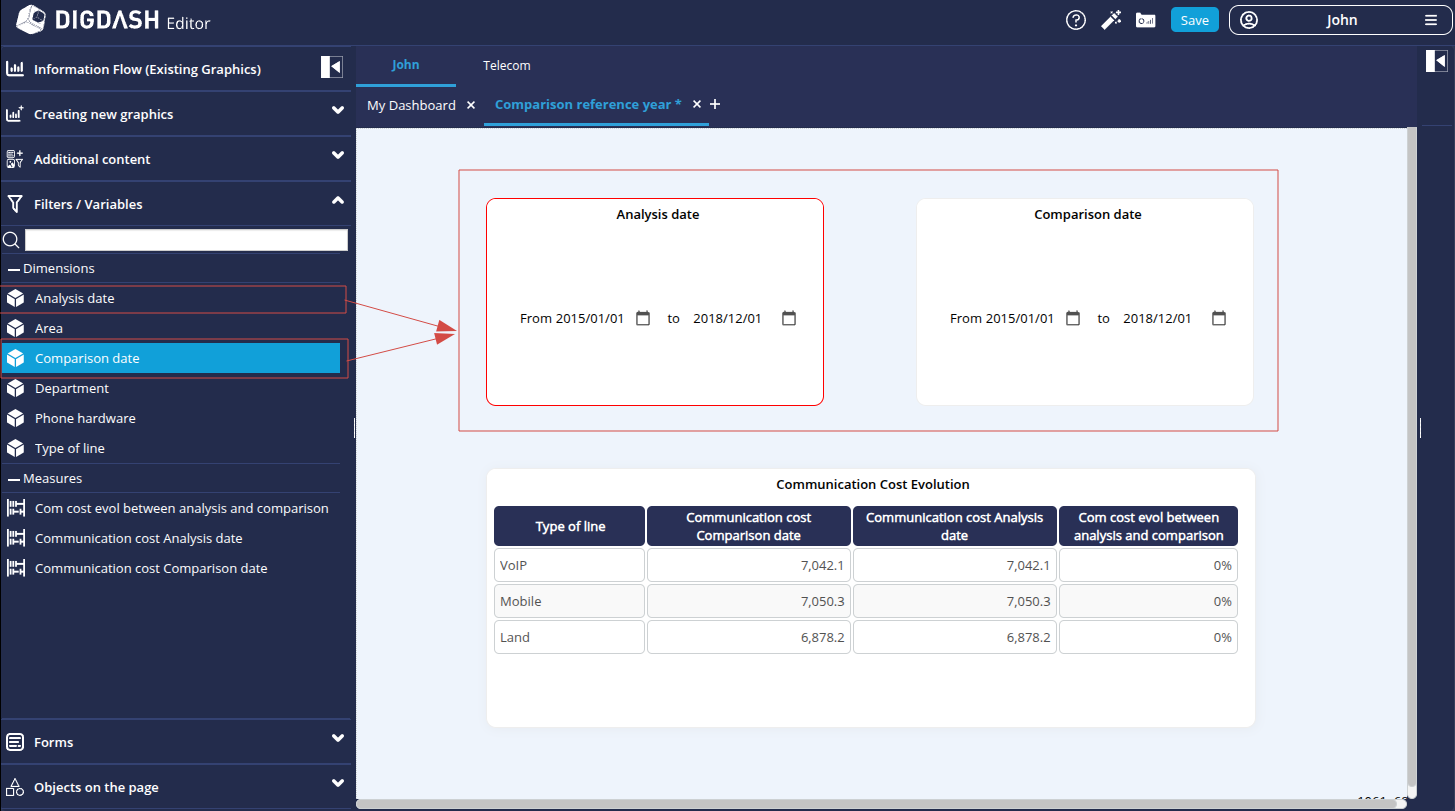
- Drag and drop the Analysis date and Comparison date dimensions from the Filters / Variables tab.
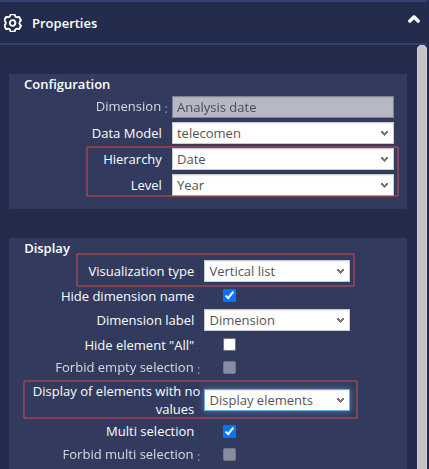
- Click the Analysis Date filter and open the properties panel on the right of the window.
- Select Vertical list as Visualization type.
- Modify the Hierarchy and Level as required: in this case Date and Year.
- For the Display elements without values option, select Display elements.
- Do the same for the Date comparison window and save.
Our dashboard page is ready!
Step 4: Navigate the data
We can now view the results and compare communication costs between different years.
- Switch to view mode using the
 button at the top right of the window and save the dashboard.
➡ The default display is as follows: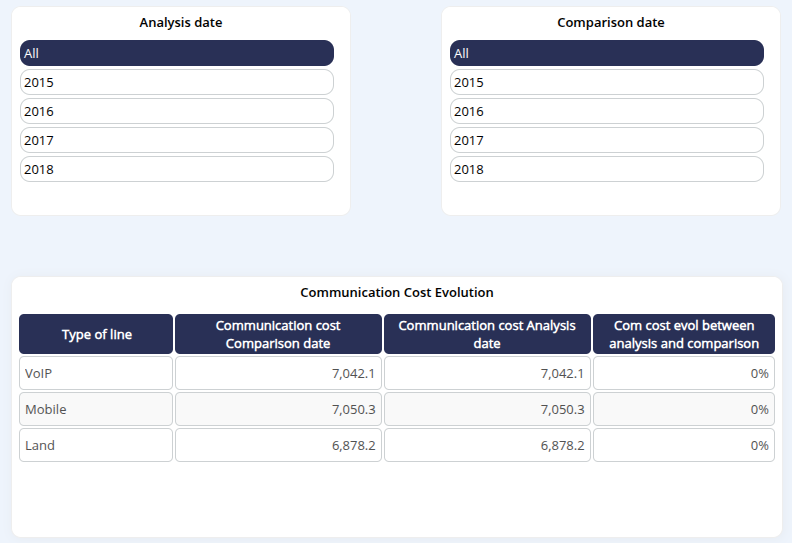
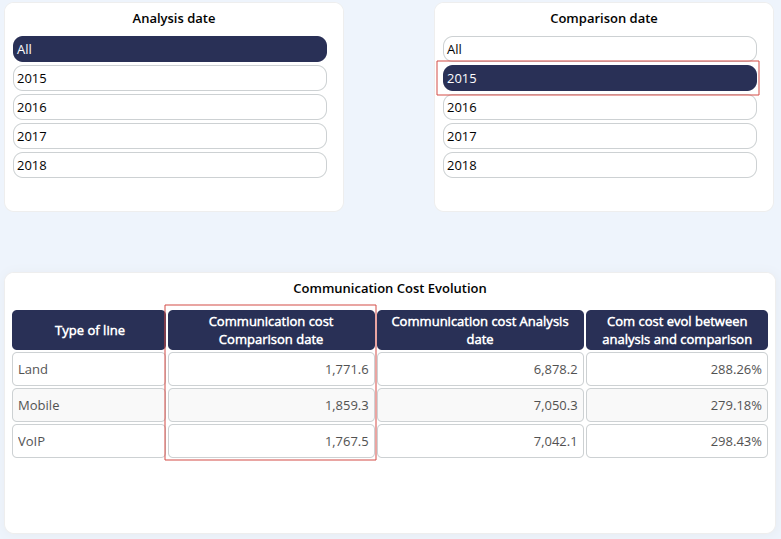
- If you change the Comparison Date, only the measure Communication cost Comparison date is impacted.
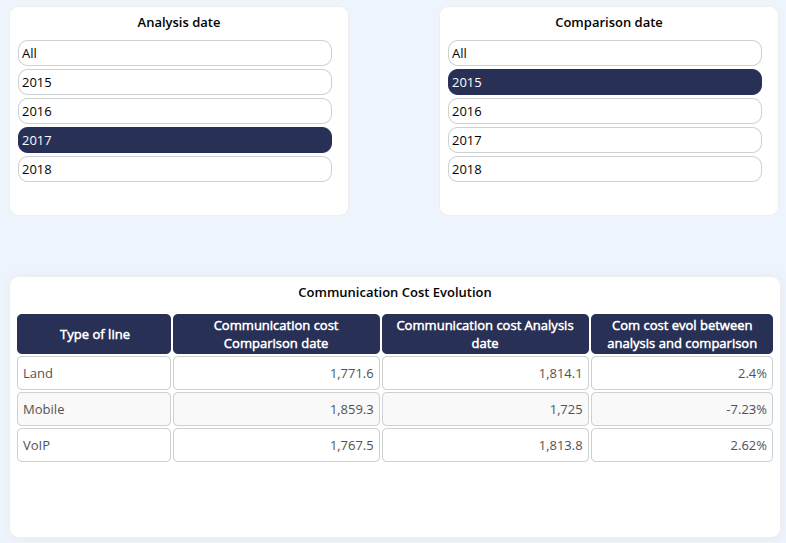
- If you then change the Analysis Date, only the measure Communication cost Analysis date is impacted.
Congratulations!
You've successfully compared data between 2 selectable dates.
Now all you have to do is apply it to your data!