
OpenStreetMap: Combining hierarchy and maps
- Introduction
- Prerequisites
- Step 1: Create and configure the data model
- Step 2: Create a multi-level map
- Step 3: Create and configure the Open Street Map
- Congratulations!
Introduction
In this tutorial, we're going to find out how to create an Open Street Map and navigate on different map backgrounds.
The dataset used in the tutorial corresponds to fictitious data on the French départements. This data is contained in the Excel file "".
This entire tutorial takes place in the Studio.
We will first create a data model in which we will define a hierarchy based on regions and departments.
We will then create a background map with 2 levels corresponding to the regions and departments.
Finally, we will create an Open Street Map and configure it using the elements previously created.
Prerequisites
In order to complete this tutorial, you will need to :
- have installed DigDash Enterprise version 2025R1 or higher;
- be a user with the "Data Model Designer" authorization group;
- download the Excel file "departements_regionsfr_en" and the Geosjson maps contained in .
ℹ The screenshots in this tutorial were produced using the Chrome browser. There may be slight differences depending on the browser.
Step 1: Create and configure the data model
Import the data
Here we're going to import the data from the Excel file "departements_regionsfr_en" (retrieved earlier).
To do this
- Launch the Studio.
- Open the Templates tab.
- Click on the New template button.
- In the Create a new data model box, select All types in the Files section.
➡ The Search remote files box appears. - In the Server drop-down list, select "Common Datasources."
- Click the Add file button.

- When the Select a local file or URL box appears, keep the default selection From your computer.
- Click Browse to select the "departements_regionsfr_en" file retrieved earlier.
- Click OK.
➡ The file is now saved on the DigDash server "Common Datasources" and accessible to all users.
- In the Search remote files dialog, select "departements_regionsfr_en".
- Click OK.
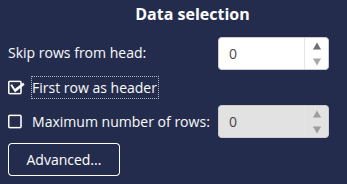
The Excel File box appears. It offers data selection options and a preview of the data.

The data includes a column DEP containing the department code, a column REG for the region code and a column Measure.
The elements in the first row of the table correspond to the data types in each column. We will therefore use them as column headers. For example, DEP for column 1. To do this:
- In the Data selection section, select the First row as header checkbox .
We can now move on to configuring the data model: click the Next button at the bottom right to open the data model configuration window.
Create the hierarchy
The data model configuration window opens on the Columns tab. We are going to create the Region-Departement hierarchy. To do this:
- Select the dimension DEP, which corresponds to the department codes. Grouping is done from the most detailed to the least detailed level.
- In the Hierarchies section, click the + button and select Automatic grouping.
➡ The Group editor dialog box is displayed. - In the Group field, enter the name of the hierarchy: Region-Department.
- In the Complete path field, select REG from the drop-down list after DEP /.
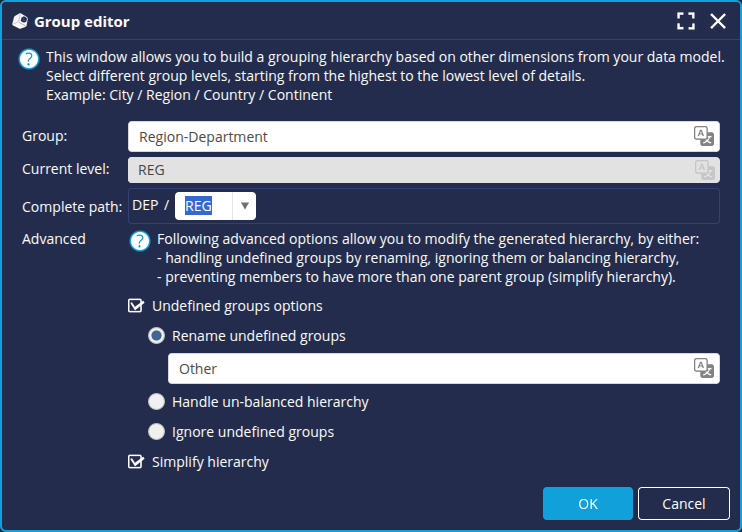
- Click OK and then Finish.
- Enter a name for the data model : Departments, and click OK.
Step 2: Create a multi-level map
We are now going to create the map with the different levels of layers corresponding to the different levels of the hierarchy.
Add the map layer for regions
We start by adding the map layer containing regions:
- From the Studio, open the Map Manager: click the Managers button in the left-hand sidebar and then select Maps.
- Click the Add map button.
➡ The New map dialog box appears. - Select the format of the map file. In this example, we use a JSON type file.
- Enter the name of the map. In this example, reg-dep.
- In the Role field, select None to share the map with all roles.
- In the File section, add the file corresponding to the map: regions.geojson
- Enter the name of the Level : here reg.

- Click OK.
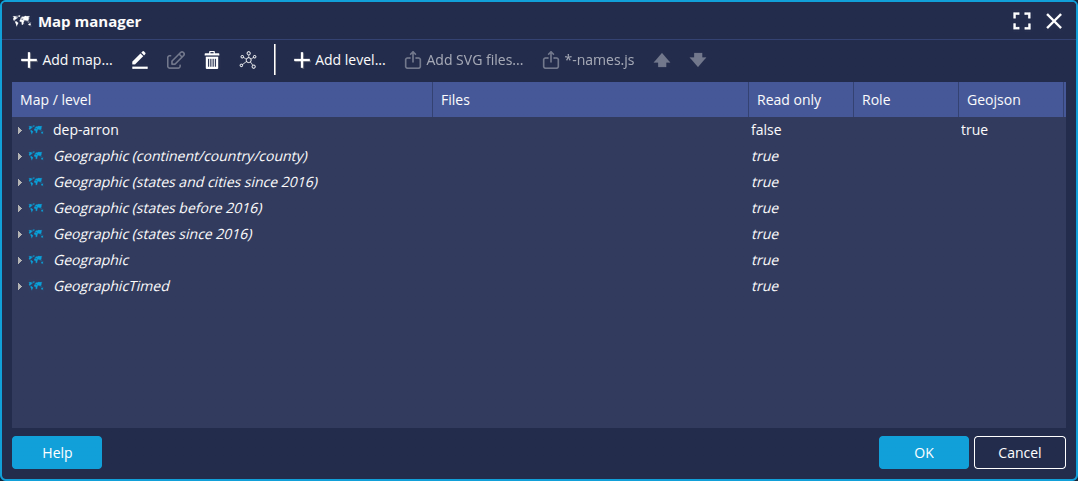
➡ The map is then added to the list of available maps.
Add the map layer for departments
Now, we add the departments map level:
- Select the newly added regions map and click the Add a level button.
- In the New map dialog box, add the departments.geojson file as before and enter the name of the level, here dep for department.

- Click OK.
➡ The dep level is added below the reg level.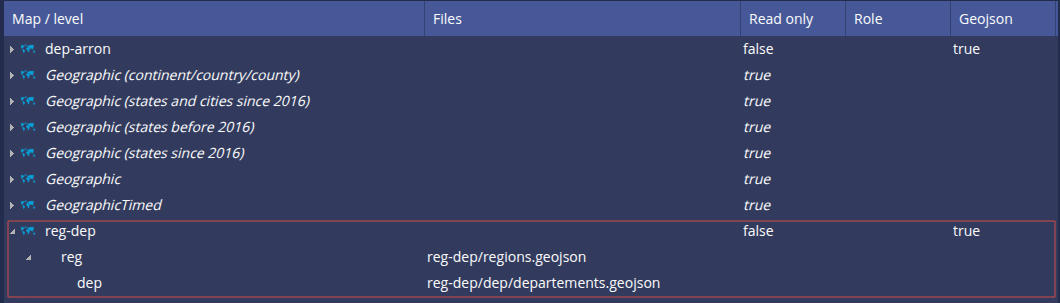
- Click OK to save the map and close the Map Manager.
Step 3: Create and configure the Open Street Map
- From the Studio Flow tab , click the New flow button.
- Select the Flow type OSM map.
➡ The Flow Properties window appears. - Select the data model created earlier: Departments.
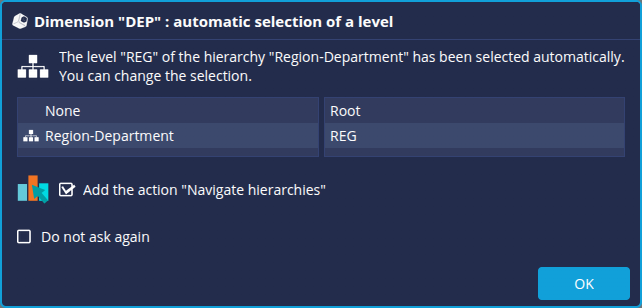
- Add the DEP dimension .
➡ The automatic level selection box is displayed. - Select the Add the action "Navigate hierarchies" checkbox and click OK.
- Add the Measure.
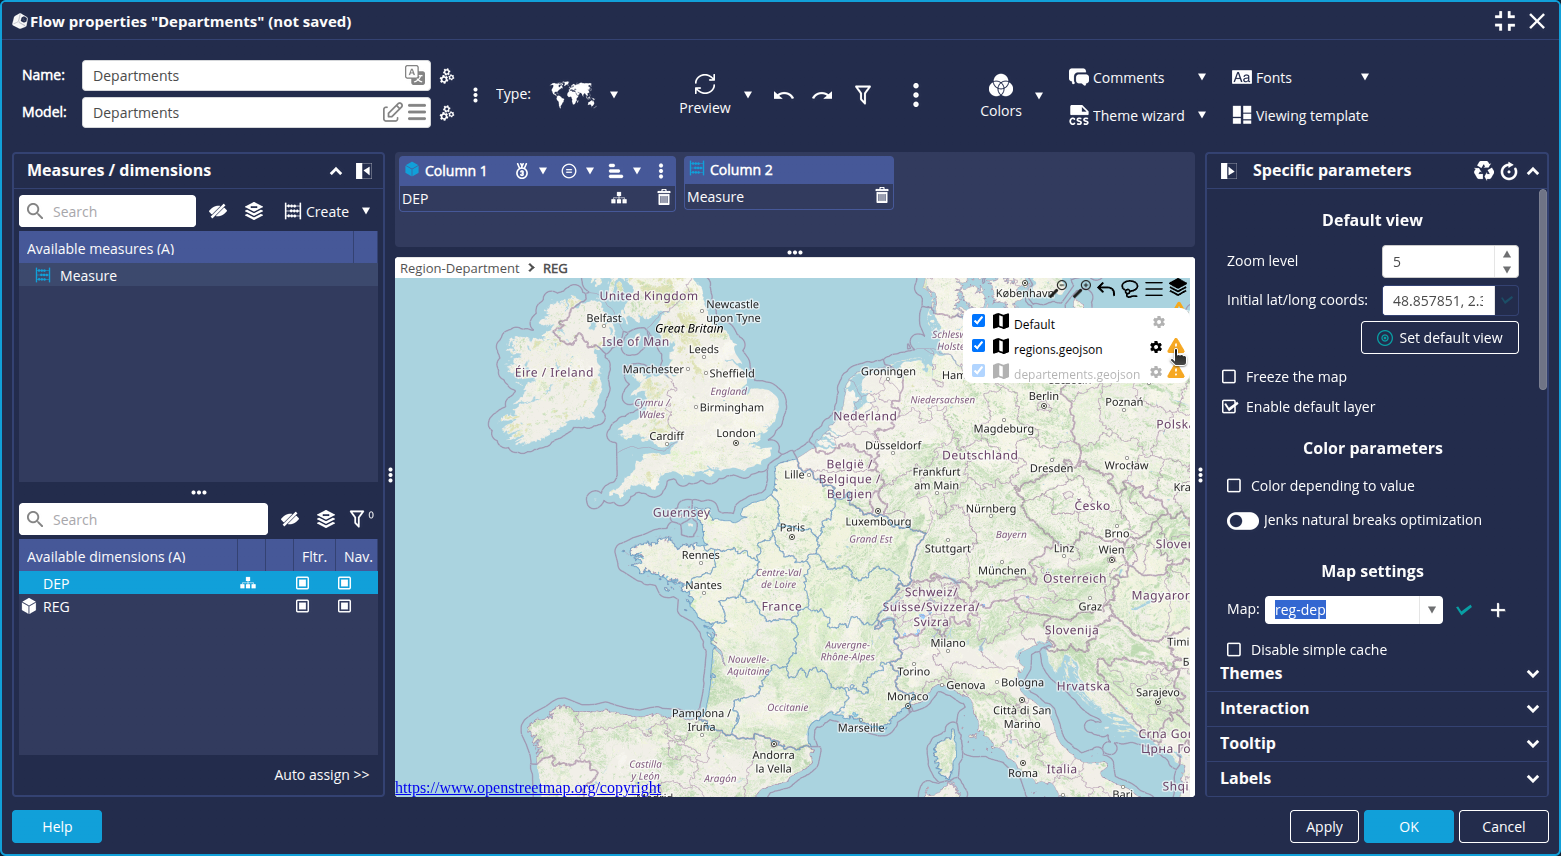
- In the Specific parameters tab,
- select the Color depending to value checkbox: to define the colour of the zone depending to the value of the associated measurement (according to the chosen colour palette)
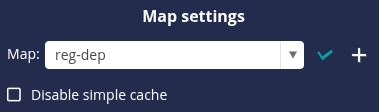
- select the map previously added and validate.
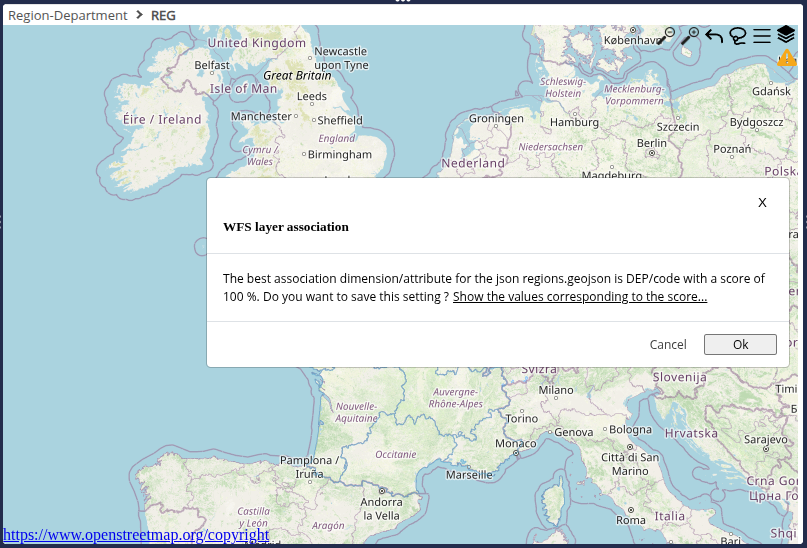
➡ In the chart preview area, a yellow warning sign flashes
- Click it and validate the WFS layer association for each level by clicking OK.
➡ The regions are displayed using the current colour palette: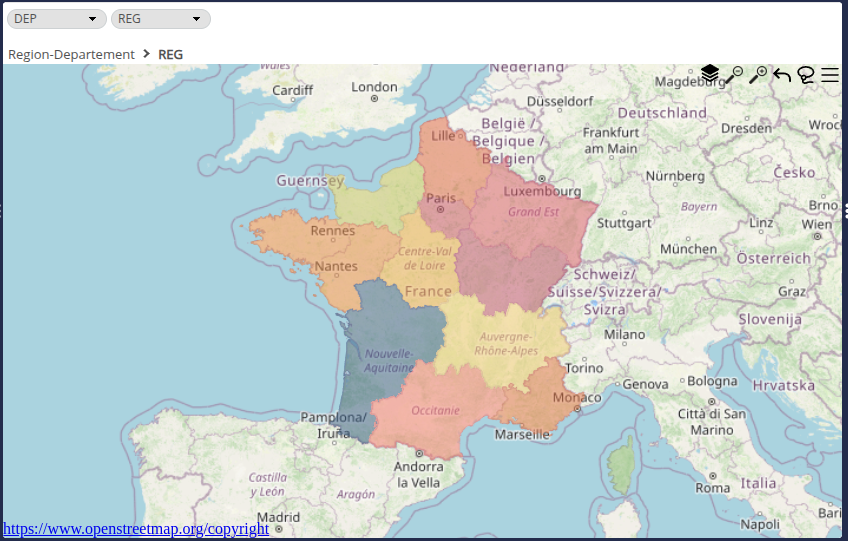
You can click the button to view the WFS layer settings.
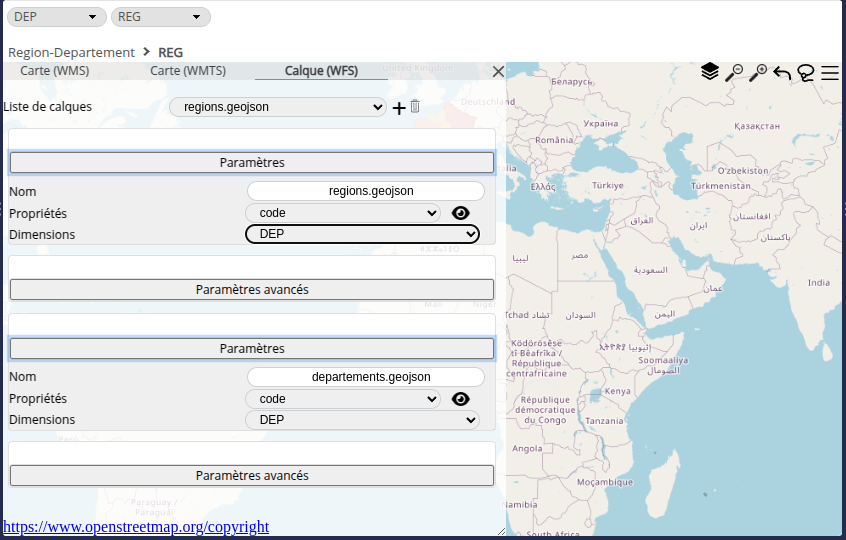
We are now going to choose a more suitable colour palette:
- Click on the Colors button on the toolbar and then the Edit button to the right of the selected palette.
➡ The Colour palette setup window appears. - Select the Flat Design 10 blue gradients palette.

We're going to add a red border to make it easier to see the boundaries of the regions:
- Click the
 button at the top right of the map and then the cogwheel next to regions.geojson.
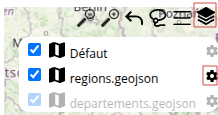
 Click in the Stroke field and select the dark red colour.
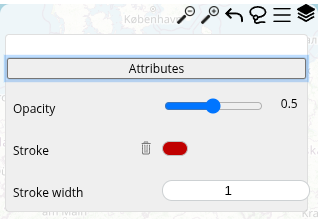
➡ We obtain the following rendering: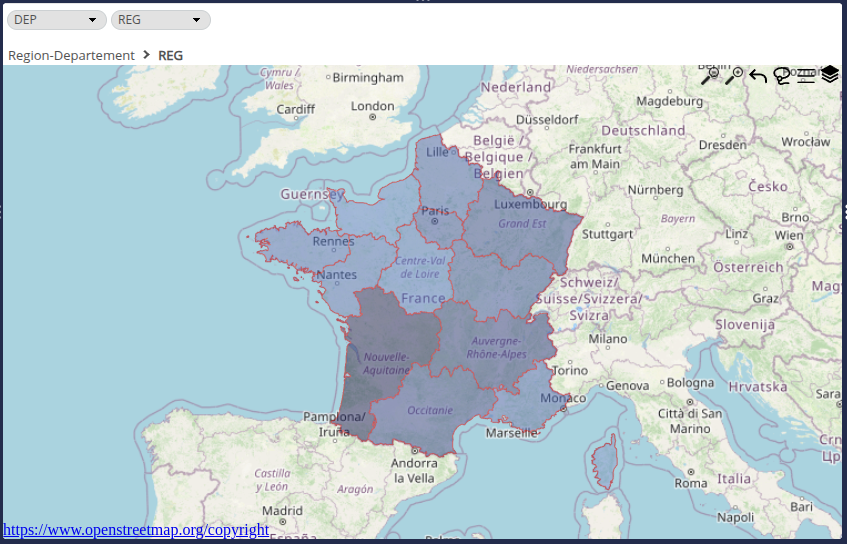
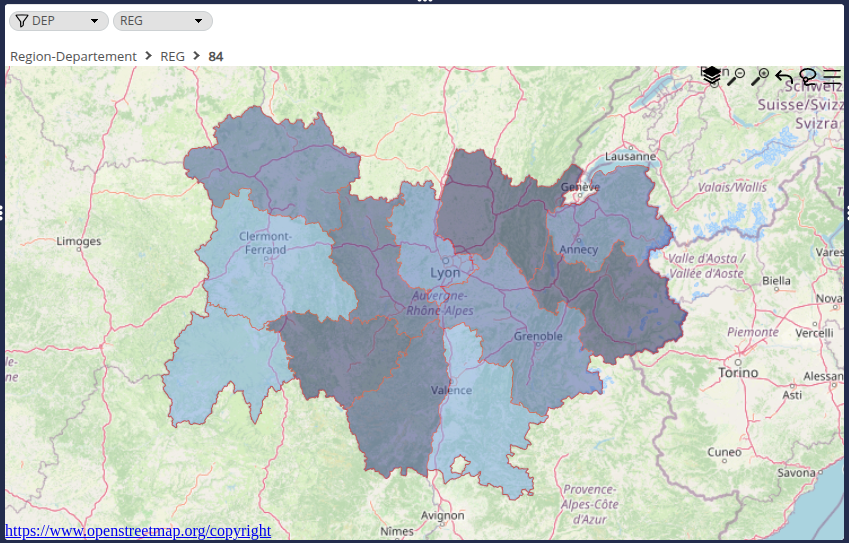
- To see details of the departments, click a region.
- Add a border for departements.geojson in the same way as above.
- Change the name of the Flow as desired and click OK.
The Open Street Map is now ready to be used in a dashboard.
Congratulations!
You've managed to create an Open Street Map and navigate on different levels.
Now all you have to do is apply it to your data!