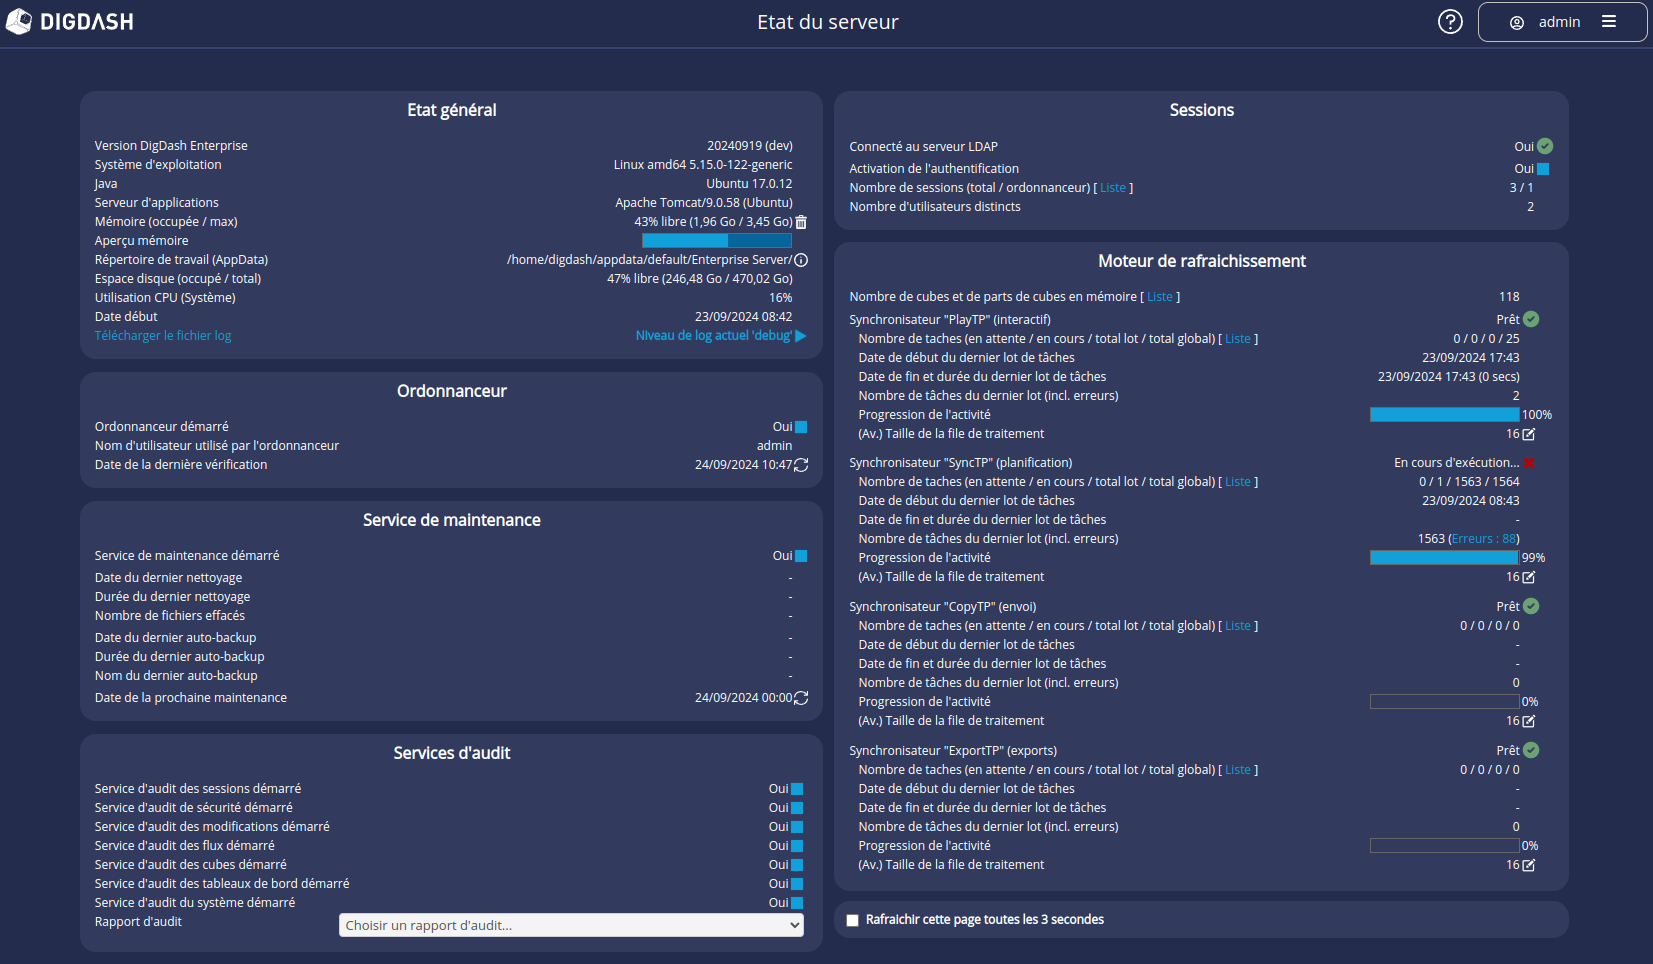
Server status
This page is used to monitor the status of the server and activate a set of services.

General status
This section is mainly used to view system information (versions installed, memory, etc) and download server logs.
| Memory (occupied/max) | Displays occupied and available memory. |
|---|---|
Memory overview
| Gives an overview of memory usage in the form of a progress bar:
Clicking on the preview bar displays a window listing the quotas defined. See the paragraph Quota management for more details. |
| Working directory (AppData) | Path to the working directory.
|
Download server logs
To retrieve the server logs, click on Log level 'debug' | Current log level 'info' then Download the log file.
The logs are particularly useful in the event of an error in your support request.
Scheduler
This section allows you to start/stop the scheduler and view its information.
The scheduler must be started for refresh programming to work. If it is stopped, click on ![]() .
.
The scheduler user must also be entered.
See the page Schedule refreshes page for more details.
You can check if there are any scheduled tasks to run by clicking on the  icon at the end of the Last check date line.
Maintenance service
This section allows you to start/stop the maintenance service and view information about the operations performed.
The maintenance service consists of :
- A file cleaner (also known as Files GC) which cleans up all unused files: old history files, cubes and other Flow-dependent files.
- An automatic configuration backup
See the Automatic Maintenance Service page for a detailed description.
To start this service, on ![]() at the end of the Maintenance service started line.
at the end of the Maintenance service started line.
By default, maintenance takes place at midnight. You can start the file cleaner immediately by clicking on the icon  icon at the end of the Next maintenance date line.
Audit services
This section allows you to start the DigDash data audit services you wish to use (session audit service, cubes, flows, etc).
Click on the ![]() icon to activate the desired audit services.
icon to activate the desired audit services.
Pre-defined reports can be accessed directly from the Choose an audit report drop-down list ... See the page DDAudit - Server status reports for details of the reports.
See the Deployment of the audit module page for details of the audit module.
Sessions
This section allows you to view general session information.
You can click on the List link next to Number of Sessions (Total / Scheduler) to view details of active sessions.
You can disable authentication for all users by clicking on the  icon on the Activate authentication line. This disables the server and prevents all users from connecting.
❗Onlythe super-user can connect to a disabled server.❗
Refresh engine
This section allows you to view in-memory cube information and synchronisation tasks.
Cubes in memory
You can click List to the right of Number of cubes and Shares of cubes in memory to view details of cubes in memory.
The Attributes column gives the following information about the cubes:
- I: Interactive use (used by flows and dashboards)
- M: In memory only
- N: Unmanaged (temporary, deleted, in generation, etc.)
- B: Cube in generation. Cube generation can be stopped by clicking on the
 button in front of the cube name (or by ticking the box and then Deleting).
 - L: Live data cube
You can delete cubes in memory by checking the corresponding box and then clicking on the Delete button orclicking on the  each one.
Synchronisers
Synchronisers are in charge of cube synchronisation tasks:
- "PlayTP" : interactive tasks (launched by the user). For example, the user synchronises a Flow in the Studio or refreshes it from the dashboard.
- "SyncTP": scheduled tasks. These are mainly tasks relating to the scheduling of refreshes. They also include Flow synchronisation tasks for users other than the logged-in user.
- "CopyTP": tasks for sending exports to their destination (devices: file server, email, SMS, etc).
- "ExportTP": conversion tasks into the format requested for the export. For example, when a user exports a graphic as a PDF.

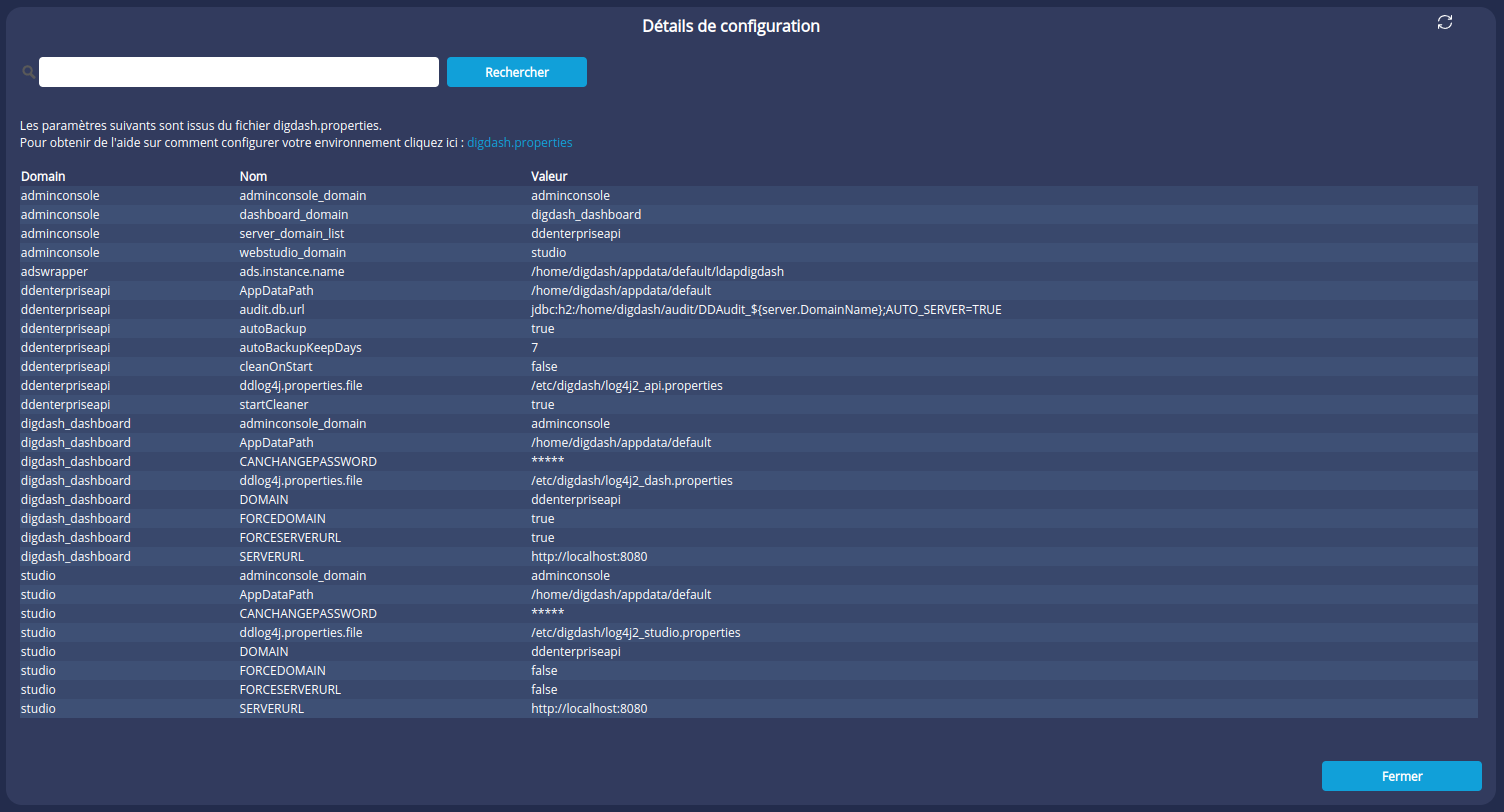
 icon will take you to the configuration details in the digdash.properties file.