Ad-hoc analysis
DigDash Enterprise provides a table editor toolbar allowing to modify the tables and cross tables in real time: adding columns or total, modifying sorts, styles,...
Modifying table becomes easy for everyone as it doesn't require any changes in the information wallet configuration.
Setting up ad-hoc analysis
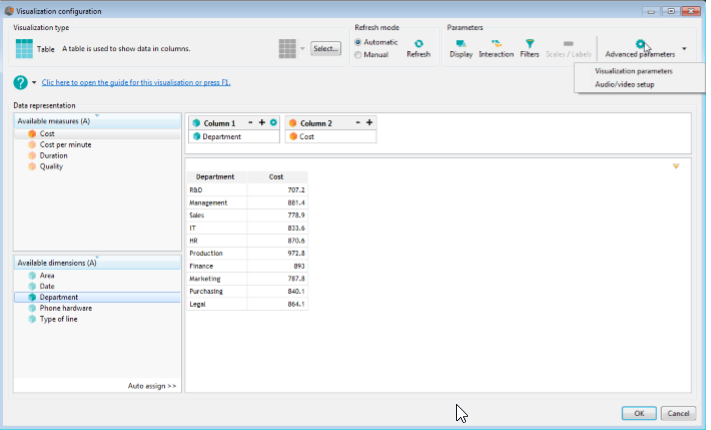
To use the “Ad-hoc analysis”, open the Visualization configuration dialog box, then click Advanced Parameters and Visualization Parameters.
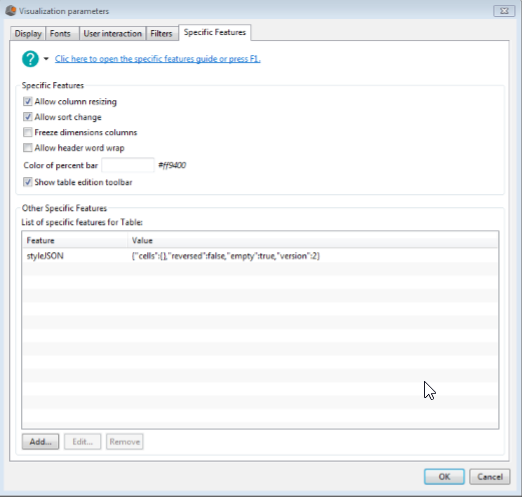
Open the Specific Features tab and check the Table editor toolbar box:
Modifying table content
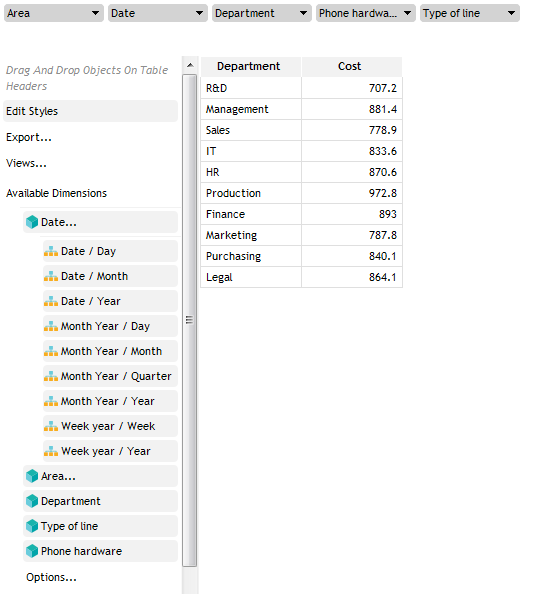
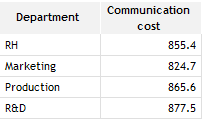
When viewing the table, the chart is displayed on the right and the table editor toolbar on the left:
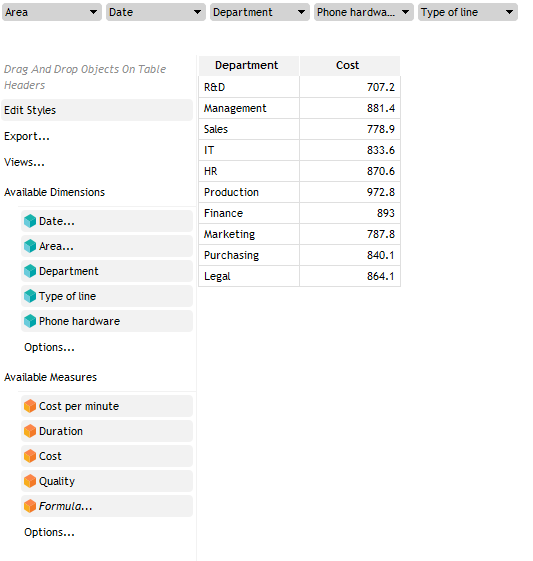
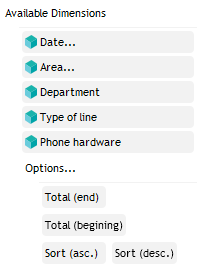
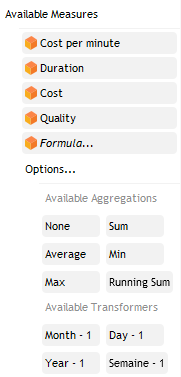
The table editor toolbar shows the list of dimensions and measures available in the data model. It also provides a set of tools allowing to export or save your table.
Dimensions having hierarchies or drill paths are followed by … Click the dimension to display available hierarchies:
Adding a column
Drag and drop the dimension or measure on the column header before which you want to insert the column.
If you want to add a hierarchy level of a dimension, click the dimension to select the appropriate level.
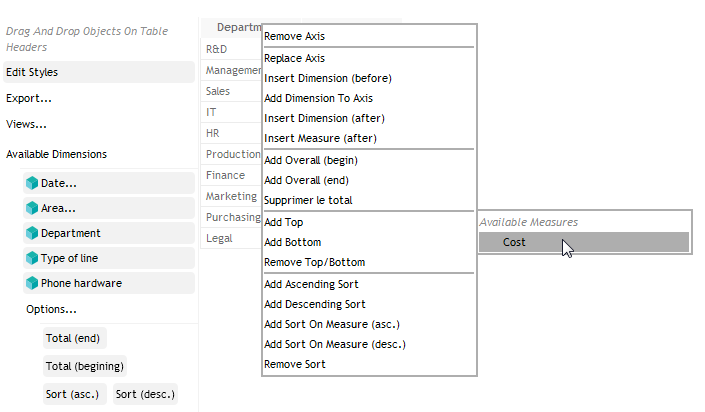
You can also add a column using right click :
Right click the header of the column before or after the column you want to add and select Insert Dimension (after or before) or Insert Measure (before or after) then
select the measure or dimension you want to add. If the dimension has hierarchies, the root level is automatically added (to add a hierarchy level, drag and drop it from the dimensions list on the left).
The Insert a measure menu is displayed only if you select a measure header or if you select the last dimension of the table (measures can only be added at the end of the table).
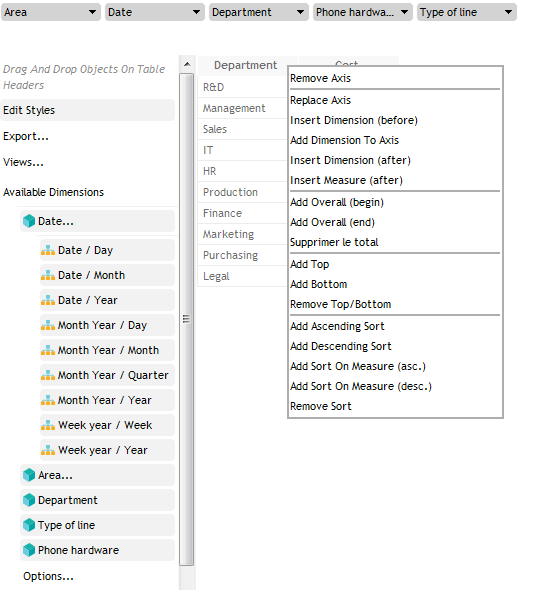
To add a dimension on the selected axis, select Add dimension To axis.
If you want to replace an axis, select Replace Axis then select the dimension.
Adding a formula:
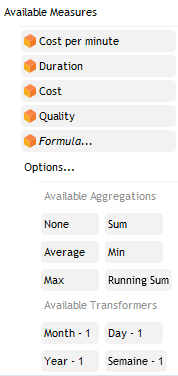
To add a formula, drag and drop “Formula...” at the end of the measures list.
A dialog box shows up. Enter the name and the formula:

You can select measures from the Available Measures... drop-down list.
You can also select a format in the drop-down list at the bottom of the dialog box. Click OK to add the new formula at the end of the table.
Adding a transformer
Transformers can be added on measures to display values for the previous year, previous month, previous week or the previous day.
To add a transformer, click Options... under Formula, then drag and drop the transformer on the appropriate measure.
Enter the measure name and click OK. The measure is added to the right of the transformed measure.
Removing a column
Drag and drop the column header on the table toolbar.
You can also right click the column header and select Remove Axis or Remove Measure.
In case several dimensions are on the same axis, you can remove on of these dimensions by selecting Remove Dimension.
Modifying axes properties
Adding or removing a total
Right click the column header then select Add Overall (begin) or Add Overall (end).
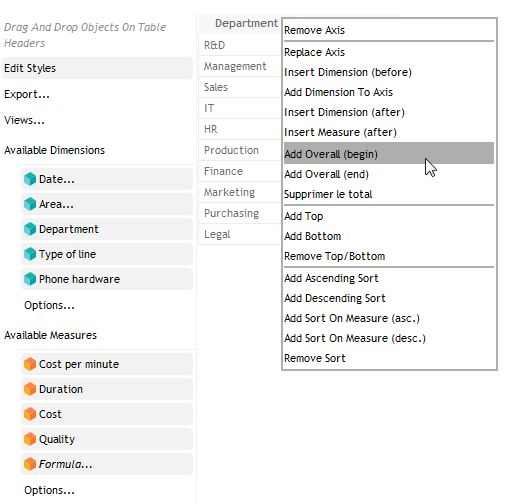
Adding overall values is also available from the dimensions options: click Options... below the dimensions list, then drag and drop Total (begin) or Total (end) on the dimension:
To remove a total, right click the dimension and select Remove Total.
Adding or removing a Top/Bottom
Right click the column header then select Add Top or Add Bottom then select the measure on which you want to apply the top or bottom. Finally, enter the number of values of your top/bottom.
To remove a Top/bottom select Remove Top/Bottom/Range.
Selecting a range of values
To select a range of values for a measure on a specific dimension, right click the dimension header, then select Add range. The list of measures table is displayed.
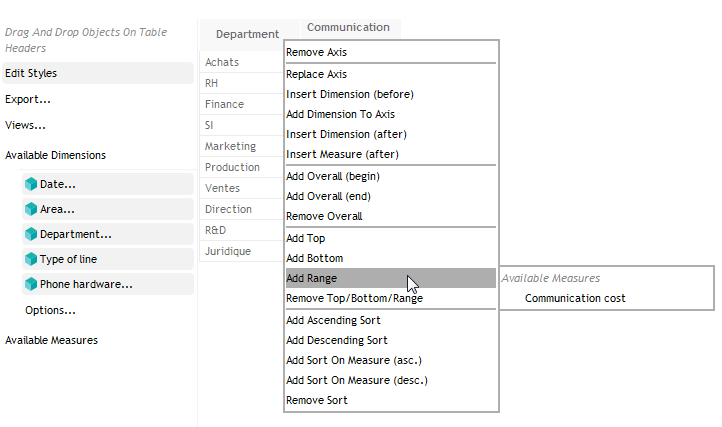
Select the measure to use then the range of values.
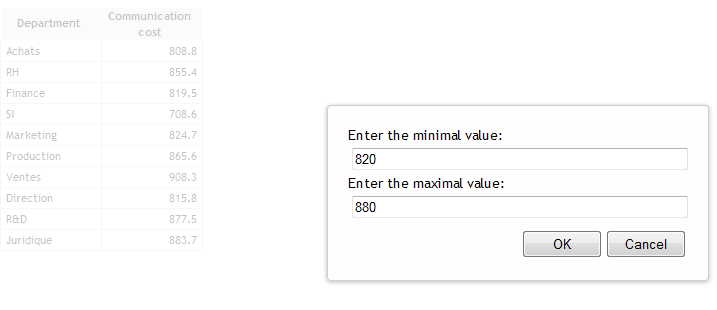
Click OK to display the resulting table:
To remove a range of values, select Remove Top/Bottom/Range.
Adding or removing a sort
Right click the column header then select Add Ascending Sort or Add Descending Sort. If you want to add a measure sort, select Add Sort on Measure (asc.) or Add Sort on Measure (desc.) then select the measure.
Adding sort is also available in the dimensions options. Click Options... below the dimensions list then drag and drop Sort (asc.) or Sort (desc.) on the dimension.

To remove a sort, right click the column header and select Remove Sort.
Modifying measure aggregation
Right click the measure header then select Change aggregation and choose one of the available functions: Sum, Average, Min, Max or Running Sum.
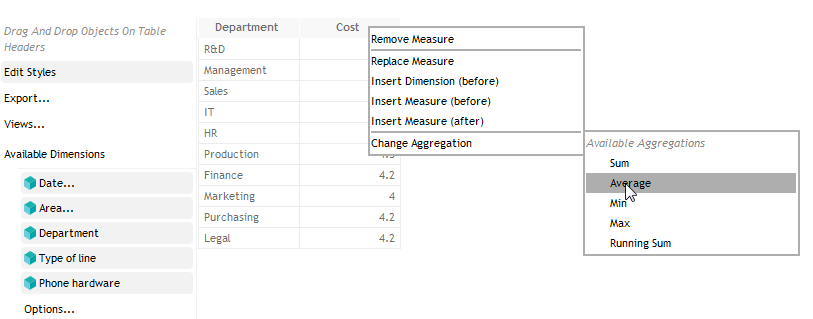
You can also change the aggregation by selecting it in the measures options. Click Options... below the measures list, then drag and drop the aggregation on the measure header.
Modifying column format
Right click the measure or continuous dimension header (date dimension for example), then select Change format and select the desired format.
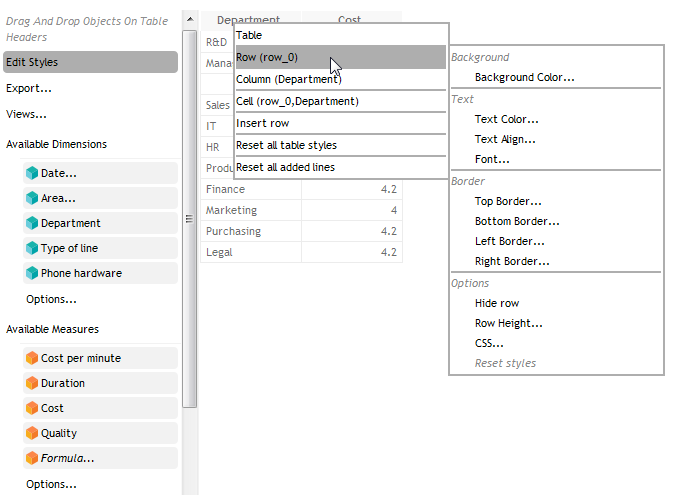
Modifying table styles
To modify the tables styles, click Edit Styles at the top of the toolbar, then click the column header to modify the column style.
- To modify a row, column or cell style: select the cell, right click and choose the element you want to modify (cell, row or column) then the modification type: background, cell or border.
- You can also:
- Hide a row or a column: select row or column, then select Hide row or Hide column.
- Change the text of a cell: select cell, then Text and enter the text. The text can include variable like ${Filter Dim} where Dim is the filtered dimension. At display, the variable is replaced by the filter value on the “Dim” dimension.
- Insert a row: select Insert Row, then indicate whether the row must be placed before or after the current row. Enter values of each row cell.
Save a table
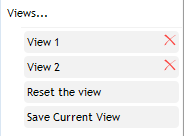
Save a view
To save the current view of your table, click Views... then Save Current View. Enter the view name, then click OK.
The view is saved in the flow. To display a view, click on its name.
To remove a view, click the red cross besides the view name.

Export a table
To export a table, click Export... then select the export type: PDF, PPT, XLS, CSV or flow. If you export your table as a flow, this one is added to the user or role wallet (same wallet as the flow you modify).
Reset the view
To display the initial table again, click Views... then Reset the view